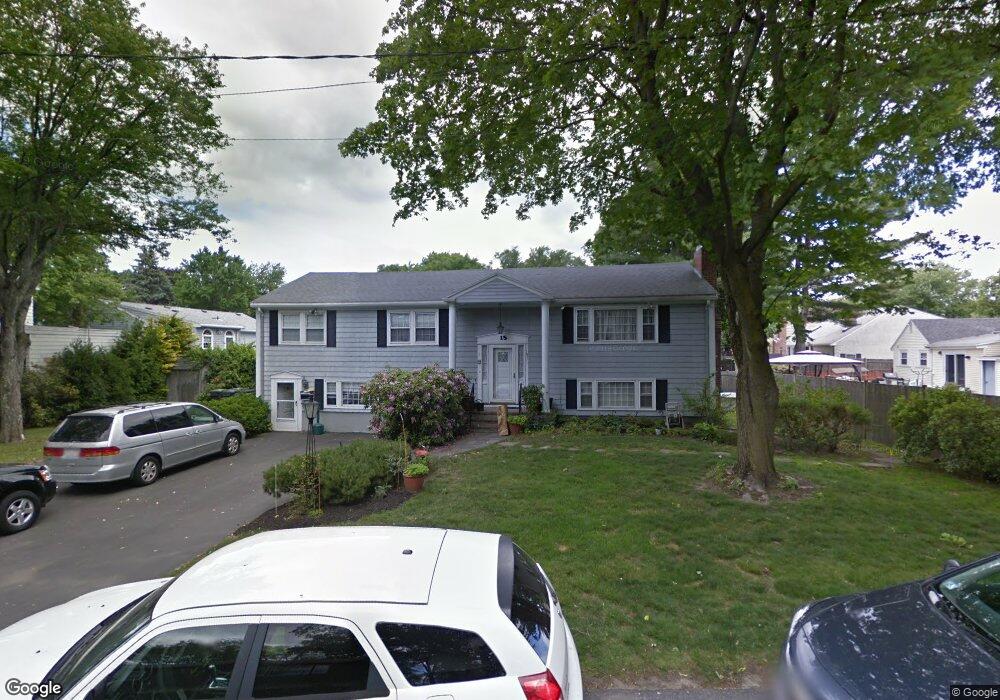
15 Iverson Way Dedham, MA 02026
Oakdale NeighborhoodEstimated Value: $760,000 - $856,000
3
Beds
3
Baths
1,404
Sq Ft
$581/Sq Ft
Est. Value
About This Home
This home is located at 15 Iverson Way, Dedham, MA 02026 and is currently estimated at $815,831, approximately $581 per square foot. 15 Iverson Way is a home located in Norfolk County with nearby schools including Oakdale Elementary School, Dedham Middle School, and Dedham High School.
Ownership History
Date
Name
Owned For
Owner Type
Purchase Details
Closed on
Jul 31, 2024
Sold by
Iverson Way Ret and Lathum
Bought by
Stewart Joi D
Current Estimated Value
Purchase Details
Closed on
Jul 19, 2013
Sold by
Lathum Jeannine M
Bought by
Iverson Way Rt
Purchase Details
Closed on
Feb 1, 1966
Bought by
Iverson Way Rt
Create a Home Valuation Report for This Property
The Home Valuation Report is an in-depth analysis detailing your home's value as well as a comparison with similar homes in the area
Home Values in the Area
Average Home Value in this Area
Purchase History
| Date | Buyer | Sale Price | Title Company |
|---|---|---|---|
| Stewart Joi D | -- | None Available | |
| Stewart Joi D | -- | None Available | |
| Iverson Way Rt | -- | -- | |
| Iverson Way Rt | -- | -- | |
| Iverson Way Rt | -- | -- |
Source: Public Records
Mortgage History
| Date | Status | Borrower | Loan Amount |
|---|---|---|---|
| Previous Owner | Iverson Way Rt | $80,000 |
Source: Public Records
Tax History
| Year | Tax Paid | Tax Assessment Tax Assessment Total Assessment is a certain percentage of the fair market value that is determined by local assessors to be the total taxable value of land and additions on the property. | Land | Improvement |
|---|---|---|---|---|
| 2025 | $10,039 | $795,500 | $377,400 | $418,100 |
| 2024 | $9,569 | $765,500 | $347,500 | $418,000 |
| 2023 | $9,672 | $753,300 | $322,500 | $430,800 |
| 2022 | $8,808 | $659,800 | $294,900 | $364,900 |
| 2021 | $8,464 | $619,200 | $294,900 | $324,300 |
| 2020 | $8,117 | $591,600 | $282,600 | $309,000 |
| 2019 | $7,825 | $553,000 | $256,400 | $296,600 |
| 2018 | $7,522 | $517,000 | $231,600 | $285,400 |
| 2017 | $7,231 | $489,900 | $222,200 | $267,700 |
| 2016 | $7,203 | $465,000 | $197,300 | $267,700 |
| 2015 | $6,645 | $418,700 | $193,200 | $225,500 |
| 2014 | $6,564 | $408,200 | $193,200 | $215,000 |
Source: Public Records
Map
Nearby Homes
- 59 Hamilton Ave
- 6 Snow Ln
- 50 Sprague St
- 600 East St
- 46 Park St
- 58 Jersey St
- 45 Circuit Rd
- 98 Cedar St Unit 2
- 22 Azalea Cir
- 72 Crane St
- 56 Mount Vernon St
- 18 Greensboro Rd
- 73 Walnut St
- 12 Blossom St
- 28 Linden Place
- 442 High St
- 441 Washington St Unit 301
- 441 Washington St Unit 302
- 90 High St Unit 309
- 108 High St
Your Personal Tour Guide
Ask me questions while you tour the home.