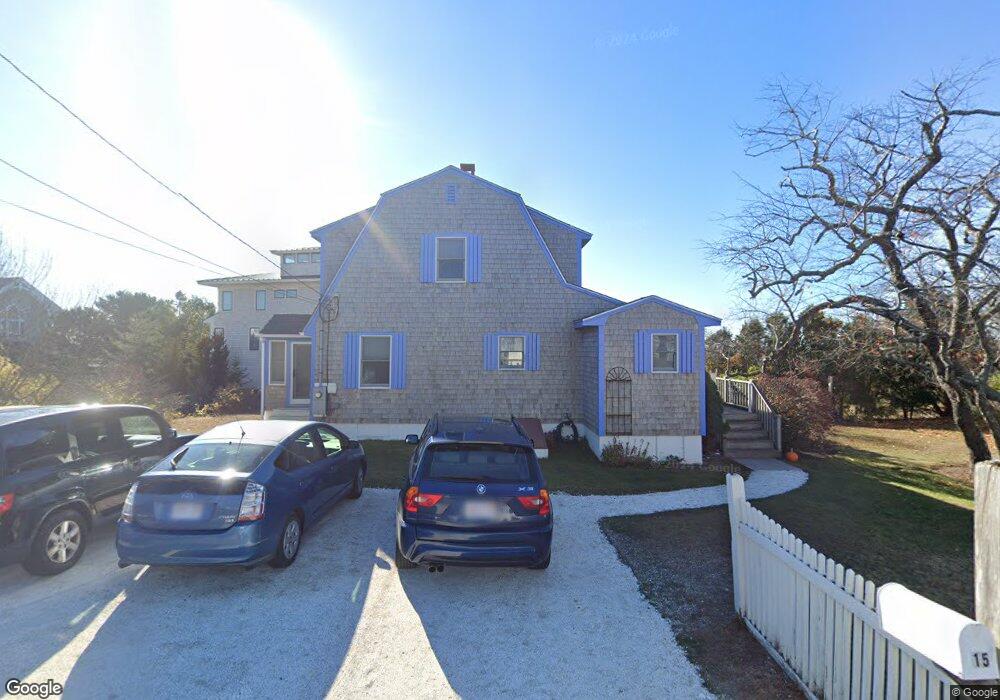
15 Jackson Way Newbury, MA 01951
Estimated Value: $1,331,000 - $1,432,000
3
Beds
2
Baths
1,363
Sq Ft
$1,005/Sq Ft
Est. Value
About This Home
This home is located at 15 Jackson Way, Newbury, MA 01951 and is currently estimated at $1,369,953, approximately $1,005 per square foot. 15 Jackson Way is a home located in Essex County with nearby schools including Triton Regional High School, River Valley Charter School, and Immaculate Conception School.
Ownership History
Date
Name
Owned For
Owner Type
Purchase Details
Closed on
Jan 23, 2021
Sold by
Anderson Jeanne E
Bought by
E Anderson 2021 T J
Current Estimated Value
Purchase Details
Closed on
Jun 25, 2002
Sold by
Berger Judith H and Berger Jeffrey H
Bought by
March Jonathan P and Anderson Jeanne E
Home Financials for this Owner
Home Financials are based on the most recent Mortgage that was taken out on this home.
Original Mortgage
$580,000
Interest Rate
6.81%
Mortgage Type
Purchase Money Mortgage
Purchase Details
Closed on
Mar 31, 1997
Sold by
Fish Martha E
Bought by
Berger Jeffrey H and Berger Judith U
Purchase Details
Closed on
Sep 13, 1995
Sold by
Ziemian Bernard J and Ziemian Mary
Bought by
Fish Martha E
Create a Home Valuation Report for This Property
The Home Valuation Report is an in-depth analysis detailing your home's value as well as a comparison with similar homes in the area
Home Values in the Area
Average Home Value in this Area
Purchase History
| Date | Buyer | Sale Price | Title Company |
|---|---|---|---|
| E Anderson 2021 T J | -- | None Available | |
| J E Anderson 2021 T | -- | None Available | |
| E Anderson 2021 T J | -- | None Available | |
| March Jonathan P | $580,000 | -- | |
| March Jonathan P | $580,000 | -- | |
| Berger Jeffrey H | $280,000 | -- | |
| Berger Jeffrey H | $280,000 | -- | |
| Fish Martha E | $162,000 | -- | |
| Fish Martha E | $162,000 | -- |
Source: Public Records
Mortgage History
| Date | Status | Borrower | Loan Amount |
|---|---|---|---|
| Previous Owner | Fish Martha E | $190,000 | |
| Previous Owner | Fish Martha E | $580,000 |
Source: Public Records
Tax History Compared to Growth
Tax History
| Year | Tax Paid | Tax Assessment Tax Assessment Total Assessment is a certain percentage of the fair market value that is determined by local assessors to be the total taxable value of land and additions on the property. | Land | Improvement |
|---|---|---|---|---|
| 2025 | $9,886 | $1,327,000 | $662,300 | $664,700 |
| 2024 | $9,614 | $1,251,800 | $618,200 | $633,600 |
| 2023 | $8,510 | $981,500 | $402,900 | $578,600 |
| 2022 | $8,245 | $847,400 | $342,200 | $505,200 |
| 2021 | $8,133 | $762,900 | $287,000 | $475,900 |
| 2020 | $7,738 | $704,100 | $242,900 | $461,200 |
| 2019 | $7,611 | $704,100 | $242,900 | $461,200 |
| 2018 | $7,276 | $667,500 | $242,900 | $424,600 |
| 2017 | $6,965 | $656,500 | $242,900 | $413,600 |
| 2016 | $6,459 | $566,600 | $242,900 | $323,700 |
| 2015 | $6,197 | $537,900 | $220,800 | $317,100 |
| 2014 | $6,089 | $537,900 | $220,800 | $317,100 |
Source: Public Records
Map
Nearby Homes
- 2 Sunset Dr
- 11 Sunset Dr
- 2 Plum Island Blvd
- 5 Northern Blvd
- 44 Old Point Rd
- 28 & 30 Plum Island Turnpike
- 65 Plum Island Turnpike
- 5 Helena St
- 4 54th St
- 12 53rd St
- 11 Harbor St
- 12 Barker St
- 24 Seaview Ln
- 7 Pine Island Rd
- 182 High Rd
- 144 High Rd
- 222 High Rd
- 105 High Rd Unit Lot 2
- 239 High Rd
- 100 High Rd
- 22 Temple Blvd
- 22 Temple Blvd
- 16 Jackson Way
- 11 Jackson Way
- 63 Sunset Dr
- 14 Jackson Way
- 18 Jackson Way
- 12 Jackson Way
- 18 Temple Blvd
- 9 Jackson Way
- 59 Jackson Way
- 20 Jackson Way + 59 Sunset Dr
- 20 Jackson Way
- 11 Independence Way
- 10 Jackson Way
- 15 Independence Way
- 59 Sunset Dr
- 7 Jackson Way
- 8 Jackson Way
- 3 Independence Way