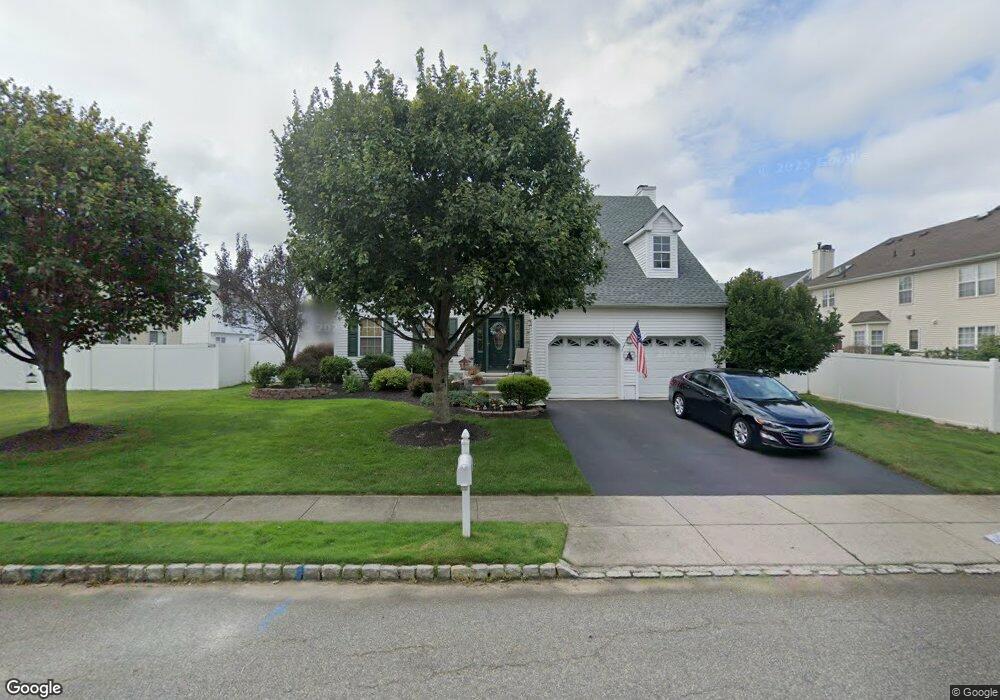
15 Jaime Ct Old Bridge, NJ 08857
Estimated Value: $635,344 - $901,000
--
Bed
--
Bath
2,198
Sq Ft
$365/Sq Ft
Est. Value
About This Home
This home is located at 15 Jaime Ct, Old Bridge, NJ 08857 and is currently estimated at $801,836, approximately $364 per square foot. 15 Jaime Ct is a home located in Middlesex County with nearby schools including Old Bridge High School, St. Thomas the Apostle School, and St. Ambrose School.
Ownership History
Date
Name
Owned For
Owner Type
Purchase Details
Closed on
May 15, 2003
Sold by
Hallman Jeffrey
Bought by
Aisenberg Ian and Aisenberg Christine
Current Estimated Value
Purchase Details
Closed on
May 16, 1994
Sold by
43 South St Assoc
Bought by
Hallman Jeffrey and Hallman Maureen
Home Financials for this Owner
Home Financials are based on the most recent Mortgage that was taken out on this home.
Original Mortgage
$206,000
Interest Rate
8.44%
Create a Home Valuation Report for This Property
The Home Valuation Report is an in-depth analysis detailing your home's value as well as a comparison with similar homes in the area
Home Values in the Area
Average Home Value in this Area
Purchase History
| Date | Buyer | Sale Price | Title Company |
|---|---|---|---|
| Aisenberg Ian | $387,951 | -- | |
| -- | $388,000 | -- | |
| Hallman Jeffrey | $217,104 | -- |
Source: Public Records
Mortgage History
| Date | Status | Borrower | Loan Amount |
|---|---|---|---|
| Previous Owner | Hallman Jeffrey | $206,000 |
Source: Public Records
Tax History Compared to Growth
Tax History
| Year | Tax Paid | Tax Assessment Tax Assessment Total Assessment is a certain percentage of the fair market value that is determined by local assessors to be the total taxable value of land and additions on the property. | Land | Improvement |
|---|---|---|---|---|
| 2025 | $12,576 | $222,700 | $65,500 | $157,200 |
| 2024 | $12,064 | $222,700 | $65,500 | $157,200 |
| 2023 | $12,064 | $222,700 | $65,500 | $157,200 |
| 2022 | $11,788 | $222,700 | $65,500 | $157,200 |
| 2021 | $8,651 | $222,700 | $65,500 | $157,200 |
| 2020 | $11,440 | $222,700 | $65,500 | $157,200 |
| 2019 | $11,246 | $222,700 | $65,500 | $157,200 |
| 2018 | $11,122 | $222,700 | $65,500 | $157,200 |
| 2017 | $10,761 | $222,700 | $65,500 | $157,200 |
| 2016 | $10,538 | $222,700 | $65,500 | $157,200 |
| 2015 | $10,356 | $222,700 | $65,500 | $157,200 |
| 2014 | $10,251 | $222,700 | $65,500 | $157,200 |
Source: Public Records
Map
Nearby Homes