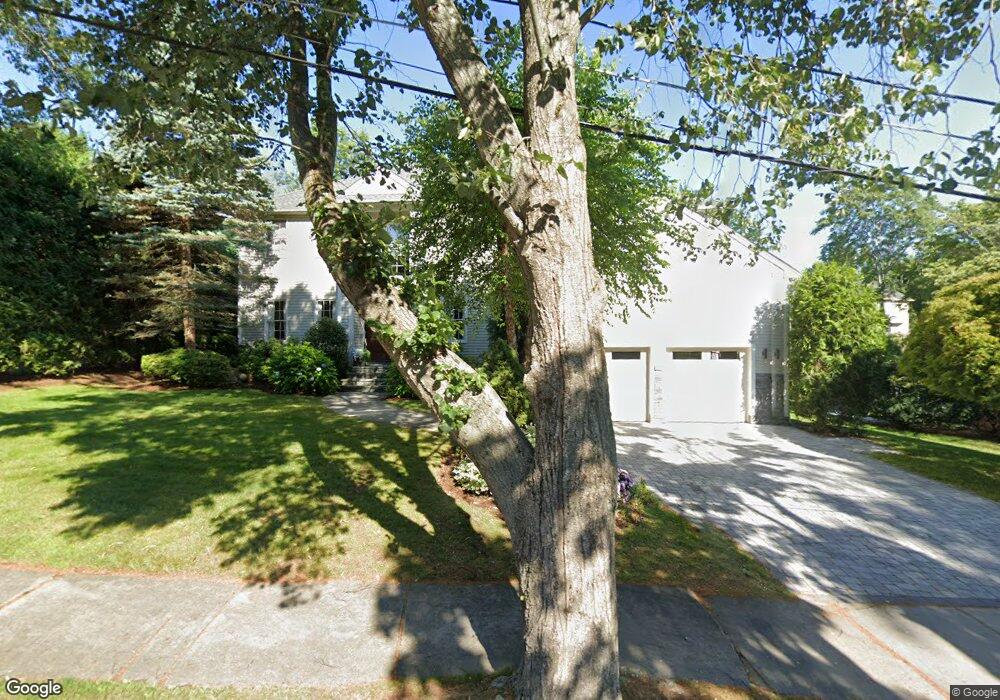
15 Jane Rd Newton Center, MA 02459
Oak Hill NeighborhoodEstimated Value: $2,361,000 - $2,838,000
4
Beds
5
Baths
5,075
Sq Ft
$500/Sq Ft
Est. Value
About This Home
This home is located at 15 Jane Rd, Newton Center, MA 02459 and is currently estimated at $2,539,118, approximately $500 per square foot. 15 Jane Rd is a home located in Middlesex County with nearby schools including Countryside Elementary School, Charles E Brown Middle School, and Newton South High School.
Ownership History
Date
Name
Owned For
Owner Type
Purchase Details
Closed on
Nov 8, 1996
Sold by
Shapiro Marion D
Bought by
Bovarnck Jay A
Current Estimated Value
Home Financials for this Owner
Home Financials are based on the most recent Mortgage that was taken out on this home.
Original Mortgage
$336,000
Interest Rate
8.1%
Mortgage Type
Purchase Money Mortgage
Create a Home Valuation Report for This Property
The Home Valuation Report is an in-depth analysis detailing your home's value as well as a comparison with similar homes in the area
Home Values in the Area
Average Home Value in this Area
Purchase History
| Date | Buyer | Sale Price | Title Company |
|---|---|---|---|
| Bovarnck Jay A | $310,000 | -- |
Source: Public Records
Mortgage History
| Date | Status | Borrower | Loan Amount |
|---|---|---|---|
| Open | Bovarnck Jay A | $940,000 | |
| Closed | Bovarnck Jay A | $100,000 | |
| Closed | Bovarnck Jay A | $336,000 | |
| Closed | Bovarnck Jay A | $90,000 |
Source: Public Records
Tax History Compared to Growth
Tax History
| Year | Tax Paid | Tax Assessment Tax Assessment Total Assessment is a certain percentage of the fair market value that is determined by local assessors to be the total taxable value of land and additions on the property. | Land | Improvement |
|---|---|---|---|---|
| 2025 | $20,592 | $2,101,200 | $1,080,700 | $1,020,500 |
| 2024 | $19,910 | $2,040,000 | $1,049,200 | $990,800 |
| 2023 | $19,351 | $1,900,900 | $813,300 | $1,087,600 |
| 2022 | $18,516 | $1,760,100 | $753,100 | $1,007,000 |
| 2021 | $17,867 | $1,660,500 | $710,500 | $950,000 |
| 2020 | $17,336 | $1,660,500 | $710,500 | $950,000 |
| 2019 | $16,846 | $1,612,100 | $689,800 | $922,300 |
| 2018 | $16,478 | $1,522,900 | $632,100 | $890,800 |
| 2017 | $15,976 | $1,436,700 | $596,300 | $840,400 |
| 2016 | $14,917 | $1,310,800 | $557,300 | $753,500 |
| 2015 | $14,222 | $1,225,000 | $520,800 | $704,200 |
Source: Public Records
Map
Nearby Homes
- 45 Brandeis Rd
- 58 Country Club Rd
- 36 Cannon St
- 415 Dedham St Unit D
- 15 Buff Cir
- 250 Woodcliff Rd
- 65 Levbert Rd
- 19 Selwyn Rd
- 35 Haynes Rd
- 21 Philbrick Rd
- 41 Juniper Ln
- 628 Boylston St
- 135 Hartman Rd
- 125 Oakdale Rd
- 59 Deborah Rd
- 1308 Walnut St
- 671 Boylston St
- 625 Boylston St
- 1292 Walnut St
- 85 Dudley Rd