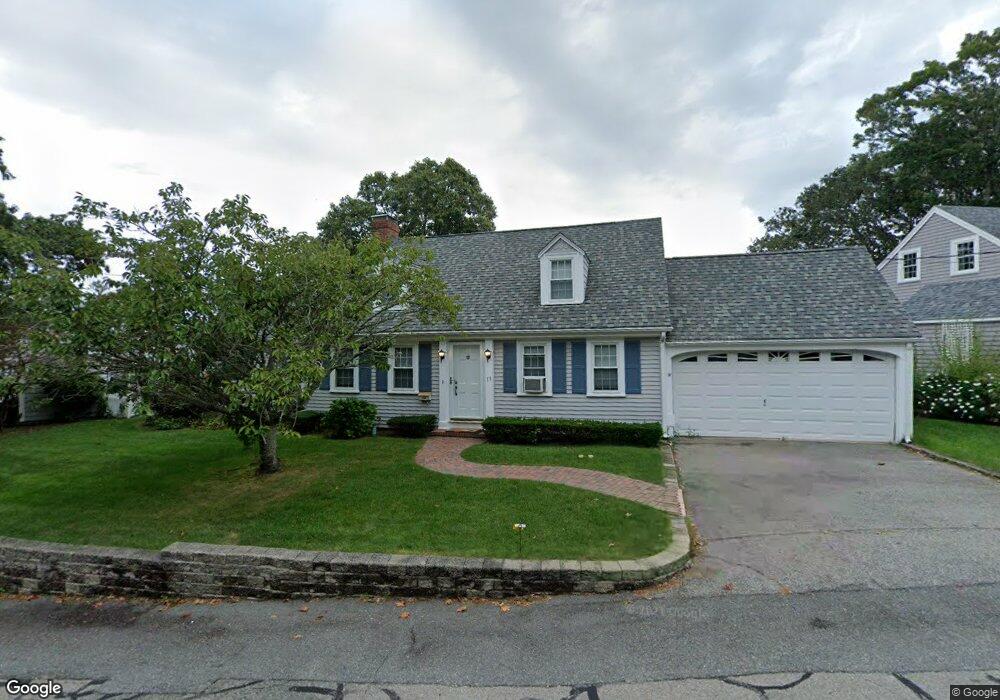
15 Jefferson Rd Buzzards Bay, MA 02532
Estimated Value: $624,000 - $670,791
3
Beds
2
Baths
1,201
Sq Ft
$539/Sq Ft
Est. Value
About This Home
This home is located at 15 Jefferson Rd, Buzzards Bay, MA 02532 and is currently estimated at $647,198, approximately $538 per square foot. 15 Jefferson Rd is a home located in Barnstable County with nearby schools including Bourne High School, St Margaret Regional School, and Cadence Academy Preschool - Bourne.
Ownership History
Date
Name
Owned For
Owner Type
Purchase Details
Closed on
Apr 1, 2005
Sold by
Bowie Mark W
Bought by
Sander Nancy L
Current Estimated Value
Home Financials for this Owner
Home Financials are based on the most recent Mortgage that was taken out on this home.
Original Mortgage
$260,000
Interest Rate
5.61%
Mortgage Type
Purchase Money Mortgage
Purchase Details
Closed on
Mar 12, 2004
Sold by
Kozak Milton H
Bought by
Bowie Mark W
Create a Home Valuation Report for This Property
The Home Valuation Report is an in-depth analysis detailing your home's value as well as a comparison with similar homes in the area
Home Values in the Area
Average Home Value in this Area
Purchase History
| Date | Buyer | Sale Price | Title Company |
|---|---|---|---|
| Sander Nancy L | $430,000 | -- | |
| Sander Nancy L | $430,000 | -- | |
| Bowie Mark W | $340,000 | -- | |
| Bowie Mark W | $340,000 | -- |
Source: Public Records
Mortgage History
| Date | Status | Borrower | Loan Amount |
|---|---|---|---|
| Open | Bowie Mark W | $15,000 | |
| Open | Bowie Mark W | $260,400 | |
| Closed | Sander Nancy L | $260,000 |
Source: Public Records
Tax History Compared to Growth
Tax History
| Year | Tax Paid | Tax Assessment Tax Assessment Total Assessment is a certain percentage of the fair market value that is determined by local assessors to be the total taxable value of land and additions on the property. | Land | Improvement |
|---|---|---|---|---|
| 2025 | $4,768 | $610,500 | $320,600 | $289,900 |
| 2024 | $4,662 | $581,300 | $305,300 | $276,000 |
| 2023 | $4,533 | $514,500 | $270,200 | $244,300 |
| 2022 | $4,369 | $433,000 | $239,100 | $193,900 |
| 2021 | $4,244 | $394,100 | $217,600 | $176,500 |
| 2020 | $4,119 | $383,500 | $215,500 | $168,000 |
| 2019 | $4,120 | $392,000 | $233,500 | $158,500 |
| 2018 | $3,496 | $331,700 | $188,200 | $143,500 |
| 2017 | $3,344 | $324,700 | $180,800 | $143,900 |
| 2016 | $3,093 | $304,400 | $180,800 | $123,600 |
| 2015 | $3,065 | $304,400 | $180,800 | $123,600 |
Source: Public Records
Map
Nearby Homes