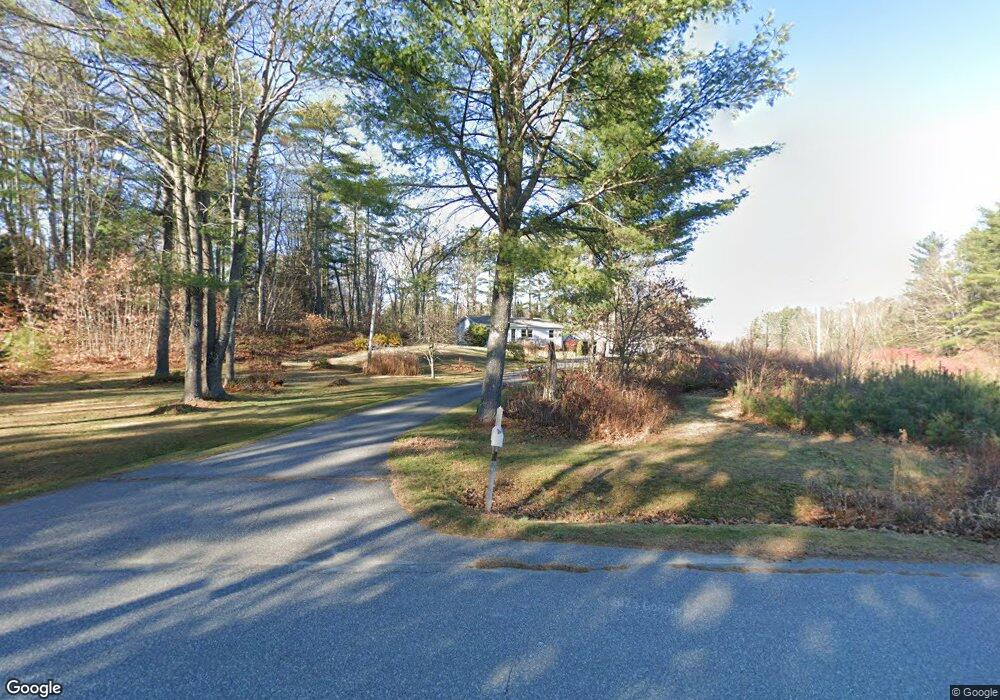
15 Jesse Rd Topsham, ME 04086
Estimated Value: $425,000 - $800,000
5
Beds
3
Baths
2,763
Sq Ft
$197/Sq Ft
Est. Value
About This Home
This home is located at 15 Jesse Rd, Topsham, ME 04086 and is currently estimated at $544,676, approximately $197 per square foot. 15 Jesse Rd is a home located in Sagadahoc County with nearby schools including Mt Ararat High School and St John's Catholic School.
Ownership History
Date
Name
Owned For
Owner Type
Purchase Details
Closed on
Jun 23, 2010
Sold by
Tardif Clayton E and Tardif Carrie A
Bought by
Fields James A and Fields Stephanie A
Current Estimated Value
Home Financials for this Owner
Home Financials are based on the most recent Mortgage that was taken out on this home.
Original Mortgage
$191,531
Outstanding Balance
$127,935
Interest Rate
4.98%
Mortgage Type
FHA
Estimated Equity
$416,741
Create a Home Valuation Report for This Property
The Home Valuation Report is an in-depth analysis detailing your home's value as well as a comparison with similar homes in the area
Home Values in the Area
Average Home Value in this Area
Purchase History
| Date | Buyer | Sale Price | Title Company |
|---|---|---|---|
| Fields James A | -- | -- |
Source: Public Records
Mortgage History
| Date | Status | Borrower | Loan Amount |
|---|---|---|---|
| Open | Fields James A | $191,531 |
Source: Public Records
Tax History
| Year | Tax Paid | Tax Assessment Tax Assessment Total Assessment is a certain percentage of the fair market value that is determined by local assessors to be the total taxable value of land and additions on the property. | Land | Improvement |
|---|---|---|---|---|
| 2025 | $5,549 | $433,500 | $84,500 | $349,000 |
| 2024 | $5,388 | $431,000 | $78,800 | $352,200 |
| 2023 | $5,209 | $383,600 | $75,100 | $308,500 |
| 2022 | $4,792 | $332,300 | $72,500 | $259,800 |
| 2021 | $4,798 | $302,300 | $66,800 | $235,500 |
| 2020 | $4,674 | $261,700 | $66,800 | $194,900 |
| 2019 | $4,732 | $247,100 | $66,800 | $180,300 |
| 2018 | $4,106 | $219,200 | $55,000 | $164,200 |
| 2017 | $3,972 | $219,200 | $55,000 | $164,200 |
| 2016 | $3,915 | $217,600 | $55,000 | $162,600 |
| 2015 | $3,818 | $212,600 | $55,000 | $157,600 |
| 2014 | $3,657 | $211,000 | $55,000 | $156,000 |
| 2013 | $3,513 | $211,000 | $55,000 | $156,000 |
Source: Public Records
Map
Nearby Homes
- 34 Compass Ln
- 54 Marc Ave
- 3 Haskell Cir
- 210 Augusta Rd
- 13 Raspberry Ln
- Lot 11 Raspberry Ln
- Lot 12 Raspberry Ln
- 88 Munroe Ln
- 14 Raspberry Ln
- 55 Munroe Ln
- 234 Congress Cir
- 3 Chickadee Dr
- 28 Jade Dr
- 23 Forest Glen Ln
- 19 Forest Glen Ln
- 481 River Rd
- 43 Forest Glen Ln
- 118 Main St
- 1 Williams Dr
- 29 Winter St