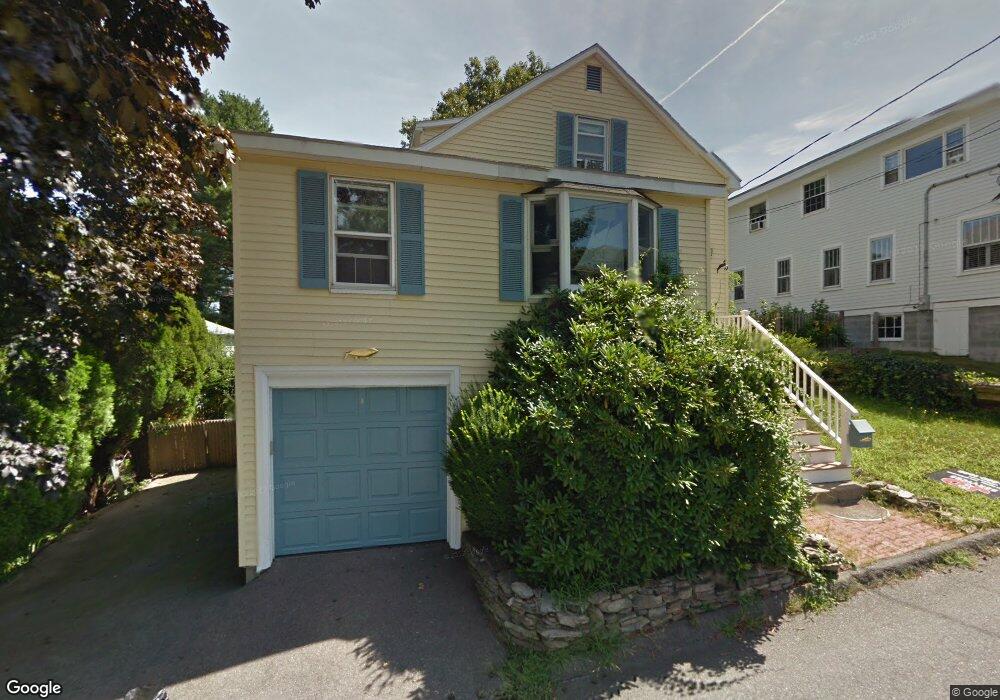
15 Johns Rd Marblehead, MA 01945
Estimated Value: $729,682 - $869,000
3
Beds
1
Bath
1,378
Sq Ft
$569/Sq Ft
Est. Value
About This Home
This home is located at 15 Johns Rd, Marblehead, MA 01945 and is currently estimated at $784,671, approximately $569 per square foot. 15 Johns Rd is a home located in Essex County with nearby schools including Marblehead High School, Marblehead Community Charter Public School, and Tower School.
Ownership History
Date
Name
Owned For
Owner Type
Purchase Details
Closed on
Oct 20, 2006
Sold by
Welch G Dudley
Bought by
Chilcott Timothy B
Current Estimated Value
Home Financials for this Owner
Home Financials are based on the most recent Mortgage that was taken out on this home.
Original Mortgage
$292,000
Interest Rate
6.49%
Mortgage Type
Purchase Money Mortgage
Purchase Details
Closed on
Oct 18, 2005
Sold by
Peake James M and Peake Karen G
Bought by
Koniares Beth Joy
Purchase Details
Closed on
Nov 28, 1997
Sold by
Coleman Ft and Coleman Frederick M
Bought by
Peake James M and Peake Karen G
Purchase Details
Closed on
Apr 13, 1989
Sold by
Johns Rt
Bought by
Coleman Fredrick M
Create a Home Valuation Report for This Property
The Home Valuation Report is an in-depth analysis detailing your home's value as well as a comparison with similar homes in the area
Home Values in the Area
Average Home Value in this Area
Purchase History
| Date | Buyer | Sale Price | Title Company |
|---|---|---|---|
| Chilcott Timothy B | $365,000 | -- | |
| Chilcott Timothy B | $365,000 | -- | |
| Koniares Beth Joy | $419,000 | -- | |
| Koniares Beth Joy | $419,000 | -- | |
| Peake James M | $190,000 | -- | |
| Peake James M | $190,000 | -- | |
| Coleman Fredrick M | $195,000 | -- | |
| Coleman Fredrick M | $195,000 | -- |
Source: Public Records
Mortgage History
| Date | Status | Borrower | Loan Amount |
|---|---|---|---|
| Open | Coleman Fredrick M | $407,000 | |
| Closed | Coleman Fredrick M | $292,000 |
Source: Public Records
Tax History
| Year | Tax Paid | Tax Assessment Tax Assessment Total Assessment is a certain percentage of the fair market value that is determined by local assessors to be the total taxable value of land and additions on the property. | Land | Improvement |
|---|---|---|---|---|
| 2025 | $5,494 | $607,100 | $460,200 | $146,900 |
| 2024 | $5,435 | $606,600 | $494,700 | $111,900 |
| 2023 | $5,704 | $570,400 | $431,400 | $139,000 |
| 2022 | $5,442 | $517,300 | $379,700 | $137,600 |
| 2021 | $5,048 | $484,500 | $368,200 | $116,300 |
| 2020 | $4,748 | $457,000 | $356,700 | $100,300 |
| 2019 | $4,722 | $439,700 | $333,700 | $106,000 |
| 2018 | $4,718 | $428,100 | $322,100 | $106,000 |
| 2017 | $4,286 | $389,300 | $287,600 | $101,700 |
| 2016 | $4,083 | $367,800 | $264,600 | $103,200 |
| 2015 | $4,235 | $382,200 | $253,100 | $129,100 |
| 2014 | $3,819 | $344,400 | $218,600 | $125,800 |
Source: Public Records
Map
Nearby Homes
- 89 Naugus Ave
- 21 Kenneth Rd
- 157 Green St Unit 3
- 4 Broadmere Way
- 9 Lincoln Park
- 1 Knollwood Rd
- 55 Roosevelt Ave
- 3 Frost Ln Unit 1
- 132 Elm St
- 132 Elm St Unit 132
- 5 Winter Island Rd
- 7 Mechanic Ct
- 6 Mount Vernon St
- 45 Pleasant St
- 66 Pleasant St Unit 1
- 66 Pleasant St Unit 2
- 26 Summer St Unit 1
- 9 Darling St
- 8 Webb St
- 17 Webb St Unit 1
Your Personal Tour Guide
Ask me questions while you tour the home.