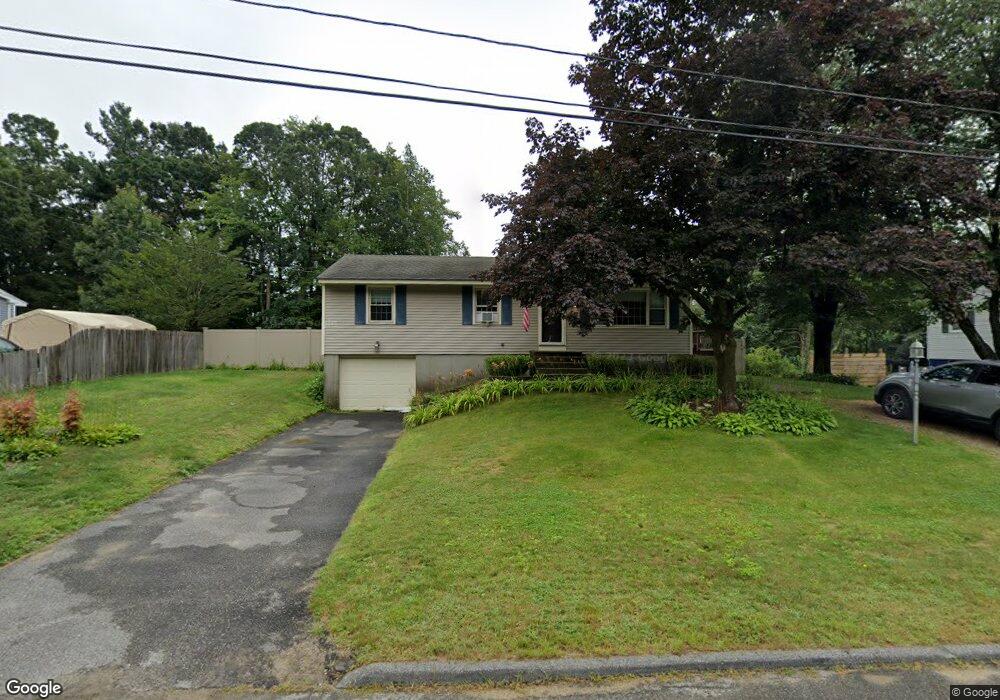
15 Juniper Ln Rutland, MA 01543
Estimated Value: $371,000 - $446,000
3
Beds
2
Baths
1,056
Sq Ft
$394/Sq Ft
Est. Value
About This Home
This home is located at 15 Juniper Ln, Rutland, MA 01543 and is currently estimated at $416,292, approximately $394 per square foot. 15 Juniper Ln is a home located in Worcester County with nearby schools including Wachusett Regional High School.
Ownership History
Date
Name
Owned For
Owner Type
Purchase Details
Closed on
Dec 22, 2014
Sold by
Harris Joseph A and Quist Robin A
Bought by
Harris Joseph A and Harris Robin A
Current Estimated Value
Home Financials for this Owner
Home Financials are based on the most recent Mortgage that was taken out on this home.
Original Mortgage
$172,000
Outstanding Balance
$59,635
Interest Rate
4.02%
Mortgage Type
New Conventional
Estimated Equity
$356,657
Purchase Details
Closed on
Nov 30, 1995
Sold by
Lynch Stephen M and Lynch Margaret
Bought by
Harris Joseph and Quist Robin
Home Financials for this Owner
Home Financials are based on the most recent Mortgage that was taken out on this home.
Original Mortgage
$100,225
Interest Rate
7.37%
Mortgage Type
Purchase Money Mortgage
Create a Home Valuation Report for This Property
The Home Valuation Report is an in-depth analysis detailing your home's value as well as a comparison with similar homes in the area
Home Values in the Area
Average Home Value in this Area
Purchase History
| Date | Buyer | Sale Price | Title Company |
|---|---|---|---|
| Harris Joseph A | -- | -- | |
| Harris Joseph | $105,500 | -- |
Source: Public Records
Mortgage History
| Date | Status | Borrower | Loan Amount |
|---|---|---|---|
| Open | Harris Joseph A | $172,000 | |
| Previous Owner | Harris Joseph | $37,300 | |
| Previous Owner | Harris Joseph | $98,600 | |
| Previous Owner | Harris Joseph | $100,225 |
Source: Public Records
Tax History Compared to Growth
Tax History
| Year | Tax Paid | Tax Assessment Tax Assessment Total Assessment is a certain percentage of the fair market value that is determined by local assessors to be the total taxable value of land and additions on the property. | Land | Improvement |
|---|---|---|---|---|
| 2025 | $4,978 | $349,600 | $95,400 | $254,200 |
| 2024 | $4,550 | $306,800 | $85,600 | $221,200 |
| 2023 | $4,183 | $304,900 | $80,800 | $224,100 |
| 2022 | $4,075 | $258,100 | $68,400 | $189,700 |
| 2021 | $3,871 | $231,800 | $68,400 | $163,400 |
| 2020 | $3,821 | $217,000 | $64,300 | $152,700 |
| 2019 | $3,701 | $206,900 | $58,900 | $148,000 |
| 2018 | $3,582 | $197,600 | $58,900 | $138,700 |
| 2017 | $3,525 | $192,400 | $58,900 | $133,500 |
| 2016 | $3,319 | $191,100 | $59,000 | $132,100 |
| 2015 | $3,119 | $176,700 | $59,000 | $117,700 |
| 2014 | $3,023 | $176,700 | $59,000 | $117,700 |
Source: Public Records
Map
Nearby Homes
- 10 Beechwood Dr
- 21 Highland Park Rd
- 7 Prescott St
- 85 Maple Ave Unit A
- 27 Lewis St
- 11 Lewis St
- 21 Lewis St
- 12 Lewis St
- 6 Lewis St
- 2 Forest Hill Dr
- 28 Forest Hill Dr
- 132 Fidelity Dr Unit 61
- 10 Fidelity Dr Unit 5
- 176 Maple Ave Unit 1-38
- 176 Maple Ave Unit 3-25
- 176 Maple Ave Unit 2-26
- 189 Maple Ave
- 25 Watson Ln
- 32 Pommogussett Rd Unit 1
- 10 Soucy Dr