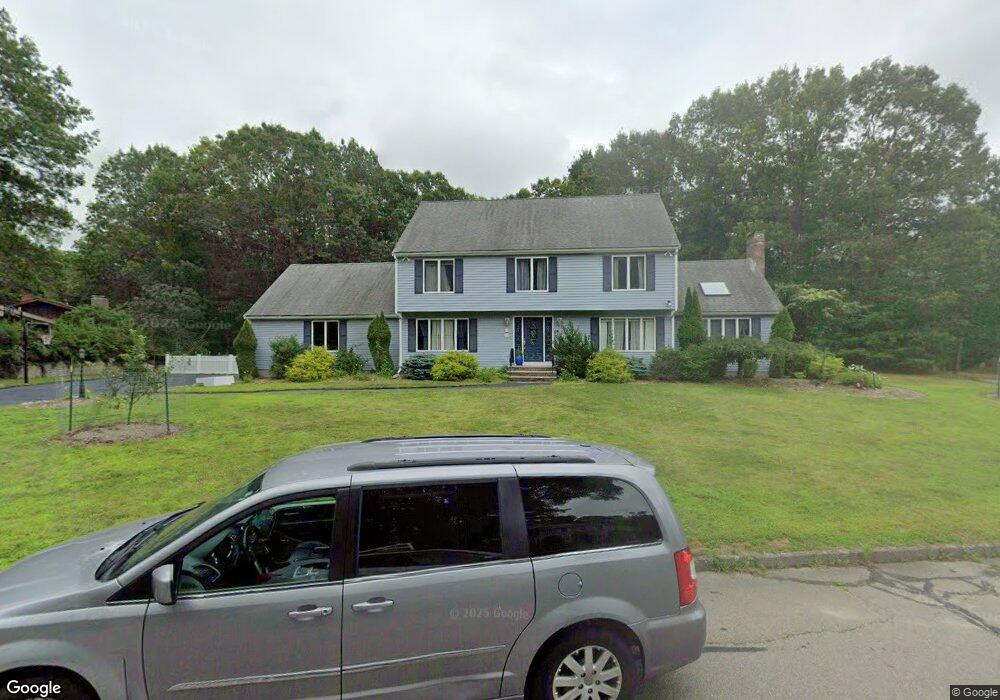
15 Juniper Rd Sharon, MA 02067
Estimated Value: $1,084,000 - $1,235,000
4
Beds
3
Baths
2,720
Sq Ft
$427/Sq Ft
Est. Value
About This Home
This home is located at 15 Juniper Rd, Sharon, MA 02067 and is currently estimated at $1,160,808, approximately $426 per square foot. 15 Juniper Rd is a home located in Norfolk County with nearby schools including East Elementary School, Sharon Middle School, and Sharon High School.
Ownership History
Date
Name
Owned For
Owner Type
Purchase Details
Closed on
Feb 24, 2022
Sold by
A G Naisuler T 2013 and Naisuler
Bought by
Giorgi Marcoandrea and Caltagirone Laura
Current Estimated Value
Home Financials for this Owner
Home Financials are based on the most recent Mortgage that was taken out on this home.
Original Mortgage
$820,250
Outstanding Balance
$760,211
Interest Rate
3.55%
Mortgage Type
Purchase Money Mortgage
Estimated Equity
$400,597
Purchase Details
Closed on
Jan 15, 2014
Sold by
Naisuler Erik C and Naisuler Allyson G
Bought by
Allyson G Naisuler T G and Allyson Naisuler
Purchase Details
Closed on
Aug 31, 2007
Sold by
Schwab Audrey B and Schwab Samuel A
Bought by
Naisuler Allyson G and Naisuler Erik C
Home Financials for this Owner
Home Financials are based on the most recent Mortgage that was taken out on this home.
Original Mortgage
$290,000
Interest Rate
6.71%
Mortgage Type
Purchase Money Mortgage
Create a Home Valuation Report for This Property
The Home Valuation Report is an in-depth analysis detailing your home's value as well as a comparison with similar homes in the area
Home Values in the Area
Average Home Value in this Area
Purchase History
| Date | Buyer | Sale Price | Title Company |
|---|---|---|---|
| Giorgi Marcoandrea | $965,000 | None Available | |
| Allyson G Naisuler T G | -- | -- | |
| Naisuler Allyson G | $640,000 | -- | |
| Naisuler Allyson G | $640,000 | -- |
Source: Public Records
Mortgage History
| Date | Status | Borrower | Loan Amount |
|---|---|---|---|
| Open | Giorgi Marcoandrea | $820,250 | |
| Previous Owner | Naisuler Allyson G | $290,000 | |
| Previous Owner | Naisuler Allyson G | $296,000 | |
| Previous Owner | Naisuler Allyson G | $290,000 |
Source: Public Records
Tax History Compared to Growth
Tax History
| Year | Tax Paid | Tax Assessment Tax Assessment Total Assessment is a certain percentage of the fair market value that is determined by local assessors to be the total taxable value of land and additions on the property. | Land | Improvement |
|---|---|---|---|---|
| 2025 | $16,491 | $943,400 | $464,200 | $479,200 |
| 2024 | $15,843 | $901,200 | $425,900 | $475,300 |
| 2023 | $15,095 | $812,000 | $398,200 | $413,800 |
| 2022 | $14,354 | $726,800 | $331,800 | $395,000 |
| 2021 | $14,227 | $696,400 | $312,800 | $383,600 |
| 2020 | $13,503 | $710,700 | $327,100 | $383,600 |
| 2019 | $12,818 | $660,400 | $276,800 | $383,600 |
| 2018 | $12,689 | $655,100 | $271,500 | $383,600 |
| 2017 | $12,508 | $637,500 | $253,900 | $383,600 |
| 2016 | $12,649 | $629,000 | $279,300 | $349,700 |
| 2015 | $12,472 | $614,400 | $279,300 | $335,100 |
| 2014 | $11,549 | $562,000 | $254,000 | $308,000 |
Source: Public Records
Map
Nearby Homes
- 6 Tall Tree Rd
- 30 Hampton Rd
- 74 Eisenhower Dr
- 40 Lyndon Rd
- 157 Wilshire Dr
- 15 Paul Revere Rd
- 71 Morse St
- 172 Wilshire Dr
- 16 Deerfield Rd
- 376 Mountain St
- 350 Mountain St
- 2 Palace Ct
- 285 Massapoag Ave
- 49 Cottage St
- 150 Pond St
- 14 Cottage St
- 137 Pond St
- 15 Sparrow Rd
- 20 Sparrow Rd
- 5 Trowel Pond Shop Rd Unit C