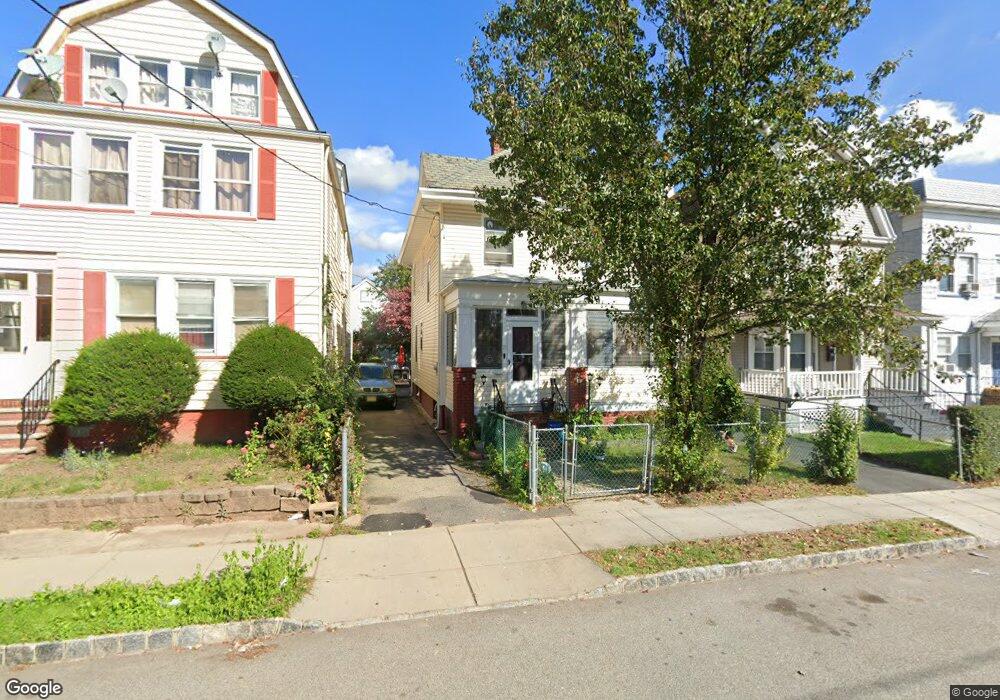
15 Kling St West Orange, NJ 07052
Estimated Value: $482,553 - $522,000
4
Beds
2
Baths
1,600
Sq Ft
$313/Sq Ft
Est. Value
About This Home
This home is located at 15 Kling St, West Orange, NJ 07052 and is currently estimated at $500,388, approximately $312 per square foot. 15 Kling St is a home located in Essex County with nearby schools including West Orange High School, East Orange Community Charter School, and Mount Carmel Guild Academy.
Ownership History
Date
Name
Owned For
Owner Type
Purchase Details
Closed on
Jan 18, 2019
Sold by
White Donald K and White Kim
Bought by
Demos Raymonde and Lafalaise Andre
Current Estimated Value
Purchase Details
Closed on
Aug 24, 2005
Purchase Details
Closed on
Oct 20, 2000
Sold by
Shiffer Judith E
Bought by
Kevin Donald and White Kim
Home Financials for this Owner
Home Financials are based on the most recent Mortgage that was taken out on this home.
Original Mortgage
$117,600
Interest Rate
7.83%
Purchase Details
Closed on
Jul 11, 1990
Sold by
Burke Irene S
Bought by
Burke Irene and Burke Shiffer,Judith
Create a Home Valuation Report for This Property
The Home Valuation Report is an in-depth analysis detailing your home's value as well as a comparison with similar homes in the area
Home Values in the Area
Average Home Value in this Area
Purchase History
| Date | Buyer | Sale Price | Title Company |
|---|---|---|---|
| Demos Raymonde | $240,000 | -- | |
| -- | -- | -- | |
| Kevin Donald | $100,000 | -- | |
| Burke Irene | -- | -- |
Source: Public Records
Mortgage History
| Date | Status | Borrower | Loan Amount |
|---|---|---|---|
| Previous Owner | Kevin Donald | $117,600 |
Source: Public Records
Tax History Compared to Growth
Tax History
| Year | Tax Paid | Tax Assessment Tax Assessment Total Assessment is a certain percentage of the fair market value that is determined by local assessors to be the total taxable value of land and additions on the property. | Land | Improvement |
|---|---|---|---|---|
| 2025 | $9,247 | $461,600 | $199,600 | $262,000 |
| 2024 | $9,247 | $201,100 | $67,200 | $133,900 |
| 2022 | $8,923 | $201,100 | $67,200 | $133,900 |
| 2021 | $8,756 | $201,100 | $67,200 | $133,900 |
| 2020 | $8,615 | $201,100 | $67,200 | $133,900 |
| 2019 | $8,368 | $201,100 | $67,200 | $133,900 |
| 2018 | $8,120 | $201,100 | $67,200 | $133,900 |
| 2017 | $8,016 | $201,100 | $67,200 | $133,900 |
| 2016 | $7,823 | $201,100 | $67,200 | $133,900 |
| 2015 | $7,676 | $201,100 | $67,200 | $133,900 |
| 2014 | $7,525 | $201,100 | $67,200 | $133,900 |
Source: Public Records
Map
Nearby Homes
- 6 Prospect Place
- 52 Columbia St
- 41 Liberty St
- 36 William St
- 62 Liberty St Unit 64
- 188 High St
- 110 Whittlesey Ave
- 15 Washington St
- 350 Main St
- 190 Watchung Ave
- 132 Franklin Ave
- 11 Meade St
- 107 High St
- 353 Bradford St
- 348 Cleveland St
- 102 Harrison Ave
- 502 Park Ave
- 42 Franklin Place
- 107 Main St
- 79 Harrison Ave