Estimated Value: $611,000 - $756,000
3
Beds
2
Baths
932
Sq Ft
$712/Sq Ft
Est. Value
About This Home
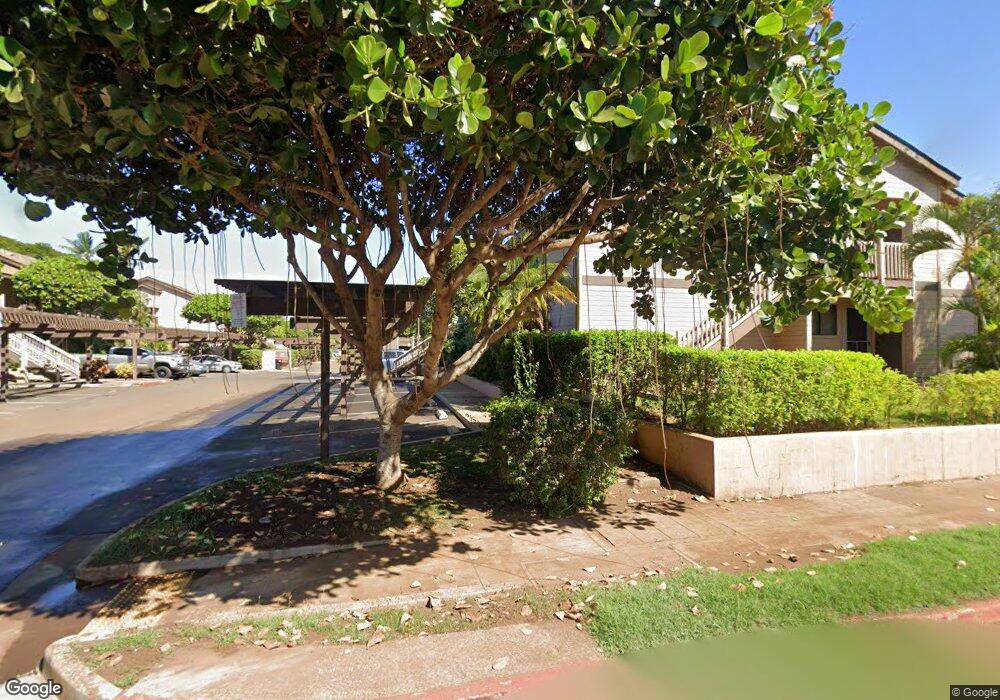
This home is located at 15 Kulanihakoi St Unit 8D, Kihei, HI 96753 and is currently estimated at $663,532, approximately $711 per square foot. 15 Kulanihakoi St Unit 8D is a home located in Maui County with nearby schools including Kihei Elementary School, Lokelani Intermediate School, and Maui High School.
Ownership History
Date
Name
Owned For
Owner Type
Purchase Details
Closed on
Dec 8, 2020
Sold by
Wan W Lee W and Wan Christine N
Bought by
Wan W Lee W and Wan Christine N
Current Estimated Value
Purchase Details
Closed on
Nov 28, 2012
Sold by
Fletcher Keith V and Wan Christine Noela
Bought by
Fletcher Keith
Purchase Details
Closed on
Aug 8, 2002
Sold by
Fletcher Keith V
Bought by
Fletcher Keith and Wan Christine Noela
Home Financials for this Owner
Home Financials are based on the most recent Mortgage that was taken out on this home.
Original Mortgage
$79,000
Outstanding Balance
$33,490
Interest Rate
6.71%
Estimated Equity
$630,042
Purchase Details
Closed on
Jul 5, 2002
Sold by
Fages Sheila
Bought by
Fletcher Keith
Home Financials for this Owner
Home Financials are based on the most recent Mortgage that was taken out on this home.
Original Mortgage
$79,000
Outstanding Balance
$33,490
Interest Rate
6.71%
Estimated Equity
$630,042
Create a Home Valuation Report for This Property
The Home Valuation Report is an in-depth analysis detailing your home's value as well as a comparison with similar homes in the area
Home Values in the Area
Average Home Value in this Area
Purchase History
| Date | Buyer | Sale Price | Title Company |
|---|---|---|---|
| Wan W Lee W | -- | None Available | |
| Wan W Lee W | -- | None Available | |
| Fletcher Keith | -- | None Available | |
| Fletcher Keith | -- | -- | |
| Fletcher Keith | $159,000 | -- |
Source: Public Records
Mortgage History
| Date | Status | Borrower | Loan Amount |
|---|---|---|---|
| Open | Fletcher Keith | $79,000 |
Source: Public Records
Tax History Compared to Growth
Tax History
| Year | Tax Paid | Tax Assessment Tax Assessment Total Assessment is a certain percentage of the fair market value that is determined by local assessors to be the total taxable value of land and additions on the property. | Land | Improvement |
|---|---|---|---|---|
| 2025 | $3,499 | $674,700 | $160,500 | $514,200 |
| 2024 | $3,499 | $596,000 | $152,500 | $443,500 |
| 2023 | $3,120 | $533,400 | $152,500 | $380,900 |
| 2022 | $2,505 | $428,200 | $128,400 | $299,800 |
| 2021 | $2,184 | $400,800 | $128,400 | $272,400 |
| 2020 | $463 | $384,500 | $128,400 | $256,100 |
| 2019 | $444 | $353,000 | $128,400 | $224,600 |
| 2018 | $400 | $298,400 | $112,400 | $186,000 |
| 2017 | $400 | $0 | $0 | $0 |
| 2016 | $3 | $266,800 | $80,300 | $186,500 |
| 2015 | $150 | $266,900 | $53,000 | $213,900 |
Source: Public Records
Map
Nearby Homes
- 15 Kulanihakoi St Unit 1H
- 15 Kulanihakoi St Unit 12E
- 15 Kulanihakoi St Unit 15D
- 15 Kulanihakoi St Unit 11B
- 15 Kulanihakoi St Unit 3E
- 15 Kulanihakoi St Unit 6D
- 15 Kulanihakoi St Unit 9D
- 811 S Kihei Rd Unit 1F
- 811 S Kihei Rd Unit 5D
- 811 S Kihei Rd Unit 2H
- 35 Heona Place
- 5 Waikalani Place
- 777 S Kihei Rd Unit 221G
- 777 S Kihei Rd Unit 102B
- 777 S Kihei Rd Unit 107A
- 27 Heona Place
- 14 Apuhihi Ln Unit 14D
- 20 Halili Ln Unit 2A
- 40 Halili Ln Unit 4M
- 70 Halili Ln Unit 7C
- 15 Kulanihakoi St Unit 9H
- 15 Kulanihakoi St Unit 9G
- 15 Kulanihakoi St Unit 9F
- 15 Kulanihakoi St Unit 9C
- 15 Kulanihakoi St Unit 9B
- 15 Kulanihakoi St Unit 9A
- 15 Kulanihakoi St Unit 8H
- 15 Kulanihakoi St Unit 8G
- 15 Kulanihakoi St Unit 8F
- 15 Kulanihakoi St Unit 8E
- 15 Kulanihakoi St Unit 8C
- 15 Kulanihakoi St Unit 8B
- 15 Kulanihakoi St Unit 8A
- 15 Kulanihakoi St Unit 7L
- 15 Kulanihakoi St Unit 7K
- 15 Kulanihakoi St Unit 7J
- 15 Kulanihakoi St Unit 7I
- 15 Kulanihakoi St Unit 7H
- 15 Kulanihakoi St Unit 7G
- 15 Kulanihakoi St Unit 7F