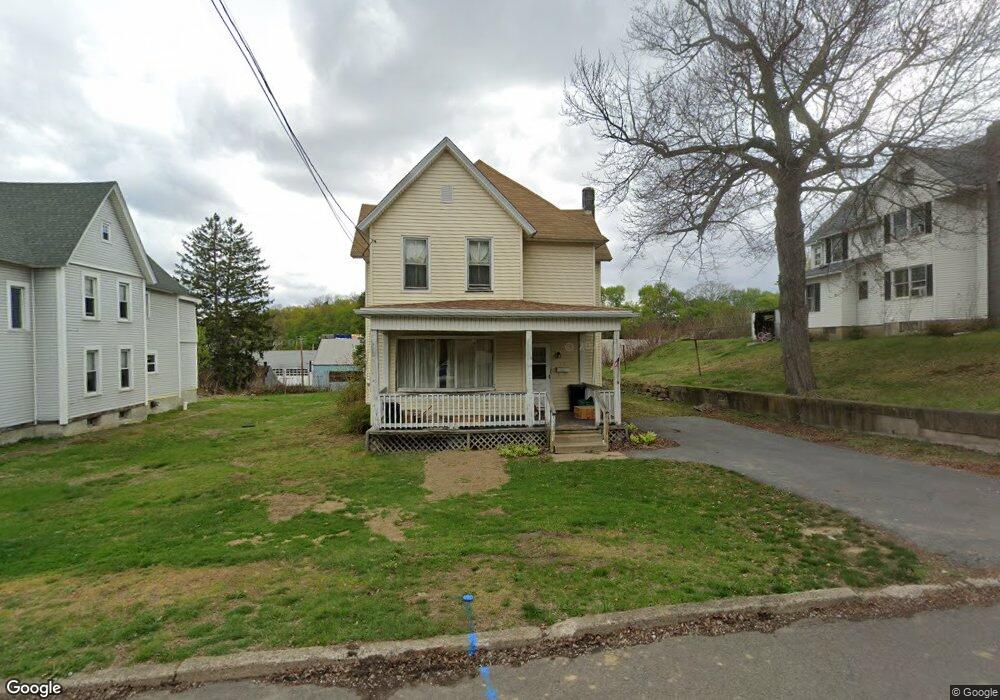
15 Landon St Pittston, PA 18640
Estimated Value: $154,000 - $258,000
4
Beds
2
Baths
2,250
Sq Ft
$83/Sq Ft
Est. Value
About This Home
This home is located at 15 Landon St, Pittston, PA 18640 and is currently estimated at $187,828, approximately $83 per square foot. 15 Landon St is a home located in Luzerne County with nearby schools including Pittston City Intermediate Center, Pittston Area Middle School, and Frederick County Middle School.
Ownership History
Date
Name
Owned For
Owner Type
Purchase Details
Closed on
Jun 17, 2024
Sold by
Webers Realty Llc
Bought by
Weber Aron Samuel
Current Estimated Value
Home Financials for this Owner
Home Financials are based on the most recent Mortgage that was taken out on this home.
Original Mortgage
$189,000
Outstanding Balance
$186,518
Interest Rate
6.87%
Mortgage Type
New Conventional
Estimated Equity
$1,310
Purchase Details
Closed on
Nov 12, 1974
Bought by
Vomero Theresa
Create a Home Valuation Report for This Property
The Home Valuation Report is an in-depth analysis detailing your home's value as well as a comparison with similar homes in the area
Home Values in the Area
Average Home Value in this Area
Purchase History
| Date | Buyer | Sale Price | Title Company |
|---|---|---|---|
| Weber Aron Samuel | $117,936 | None Listed On Document | |
| Vomero Theresa | -- | -- |
Source: Public Records
Mortgage History
| Date | Status | Borrower | Loan Amount |
|---|---|---|---|
| Open | Weber Aron Samuel | $189,000 |
Source: Public Records
Tax History Compared to Growth
Tax History
| Year | Tax Paid | Tax Assessment Tax Assessment Total Assessment is a certain percentage of the fair market value that is determined by local assessors to be the total taxable value of land and additions on the property. | Land | Improvement |
|---|---|---|---|---|
| 2025 | $2,436 | $81,900 | $18,300 | $63,600 |
| 2024 | $2,436 | $81,900 | $18,300 | $63,600 |
| 2023 | $2,436 | $81,900 | $18,300 | $63,600 |
| 2022 | $2,421 | $81,900 | $18,300 | $63,600 |
| 2021 | $2,421 | $81,900 | $18,300 | $63,600 |
| 2020 | $2,375 | $81,900 | $18,300 | $63,600 |
| 2019 | $2,359 | $81,900 | $18,300 | $63,600 |
| 2018 | $2,319 | $81,900 | $18,300 | $63,600 |
| 2017 | $2,277 | $81,900 | $18,300 | $63,600 |
| 2016 | -- | $81,900 | $18,300 | $63,600 |
| 2015 | $1,345 | $81,900 | $18,300 | $63,600 |
| 2014 | $1,345 | $81,900 | $18,300 | $63,600 |
Source: Public Records
Map
Nearby Homes