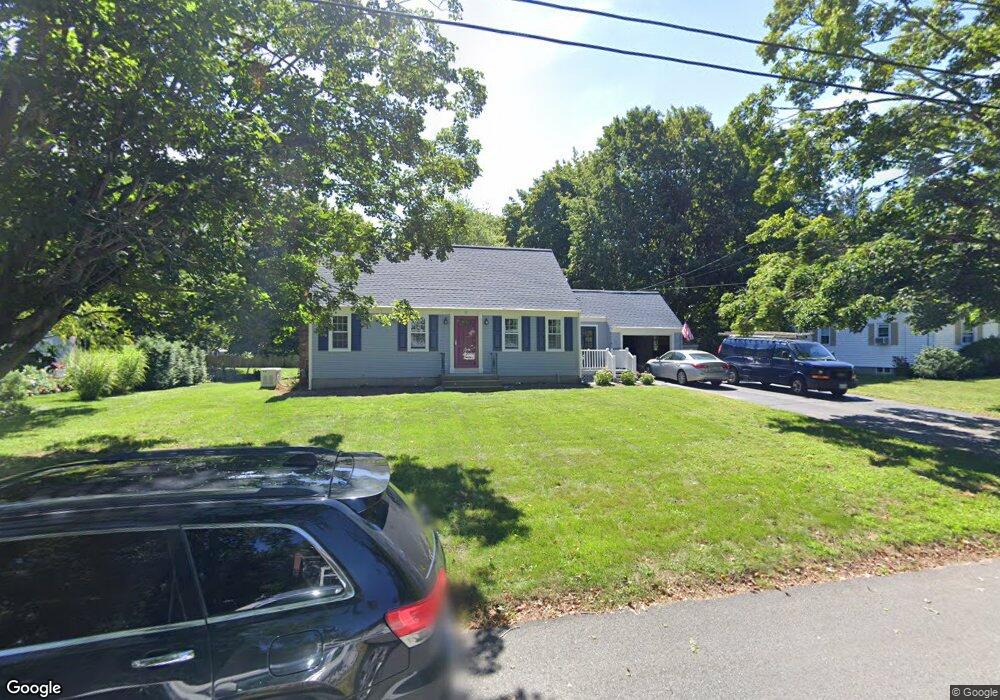
15 Laurel Ln Barrington, RI 02806
Hampden Meadows NeighborhoodEstimated Value: $712,000 - $817,000
3
Beds
2
Baths
1,956
Sq Ft
$388/Sq Ft
Est. Value
About This Home
This home is located at 15 Laurel Ln, Barrington, RI 02806 and is currently estimated at $759,463, approximately $388 per square foot. 15 Laurel Ln is a home located in Bristol County with nearby schools including Barrington High School, Barrington Christian Academy, and St. Andrews School.
Ownership History
Date
Name
Owned For
Owner Type
Purchase Details
Closed on
Jan 13, 2023
Sold by
Cecil & F Breton Irt and Breton
Bought by
Brown Lois R
Current Estimated Value
Home Financials for this Owner
Home Financials are based on the most recent Mortgage that was taken out on this home.
Original Mortgage
$175,000
Outstanding Balance
$169,469
Interest Rate
6.48%
Mortgage Type
Stand Alone Refi Refinance Of Original Loan
Estimated Equity
$589,994
Purchase Details
Closed on
Jan 12, 2016
Sold by
Breton Cecil C and Breton Florence E
Bought by
Cecil and Florence Breton
Create a Home Valuation Report for This Property
The Home Valuation Report is an in-depth analysis detailing your home's value as well as a comparison with similar homes in the area
Home Values in the Area
Average Home Value in this Area
Purchase History
| Date | Buyer | Sale Price | Title Company |
|---|---|---|---|
| Brown Lois R | $550,000 | None Available | |
| Cecil | -- | -- |
Source: Public Records
Mortgage History
| Date | Status | Borrower | Loan Amount |
|---|---|---|---|
| Open | Brown Lois R | $175,000 |
Source: Public Records
Tax History Compared to Growth
Tax History
| Year | Tax Paid | Tax Assessment Tax Assessment Total Assessment is a certain percentage of the fair market value that is determined by local assessors to be the total taxable value of land and additions on the property. | Land | Improvement |
|---|---|---|---|---|
| 2025 | $9,311 | $607,000 | $300,000 | $307,000 |
| 2024 | $8,953 | $607,000 | $300,000 | $307,000 |
| 2023 | $8,039 | $396,000 | $193,000 | $203,000 |
| 2022 | $7,781 | $396,000 | $193,000 | $203,000 |
| 2021 | $7,583 | $396,000 | $193,000 | $203,000 |
| 2020 | $7,357 | $352,000 | $167,000 | $185,000 |
| 2019 | $7,075 | $352,000 | $167,000 | $185,000 |
| 2018 | $6,864 | $352,000 | $167,000 | $185,000 |
| 2017 | $6,724 | $336,200 | $162,200 | $174,000 |
| 2016 | $6,203 | $336,200 | $162,200 | $174,000 |
| 2015 | $6,136 | $336,200 | $162,200 | $174,000 |
| 2014 | $5,845 | $319,400 | $149,100 | $170,300 |
Source: Public Records
Map
Nearby Homes
- 27 Christine Dr
- 1 Cheshire Dr
- 7 Cheshire Dr
- 15 George w Finnerty Rd
- 15 Lamson Rd
- 7 Simmons Rd
- 7 Wright Place
- 20 Burr Ave
- 0 Lillis Ave
- 195 Barney Ave
- 351 County Rd
- 0 Hampden St
- 22 Mayfield Rd
- 43 Baptist St
- 1261 Grand Army of the Republic Hwy
- 6 Kenmore Ct
- 10 Jesse Davis Ln
- 11 Mathewson Rd
- 13 Kelly St
- 6 Hazelton Rd