Estimated Value: $643,000 - $685,000
3
Beds
2
Baths
1,330
Sq Ft
$495/Sq Ft
Est. Value
About This Home
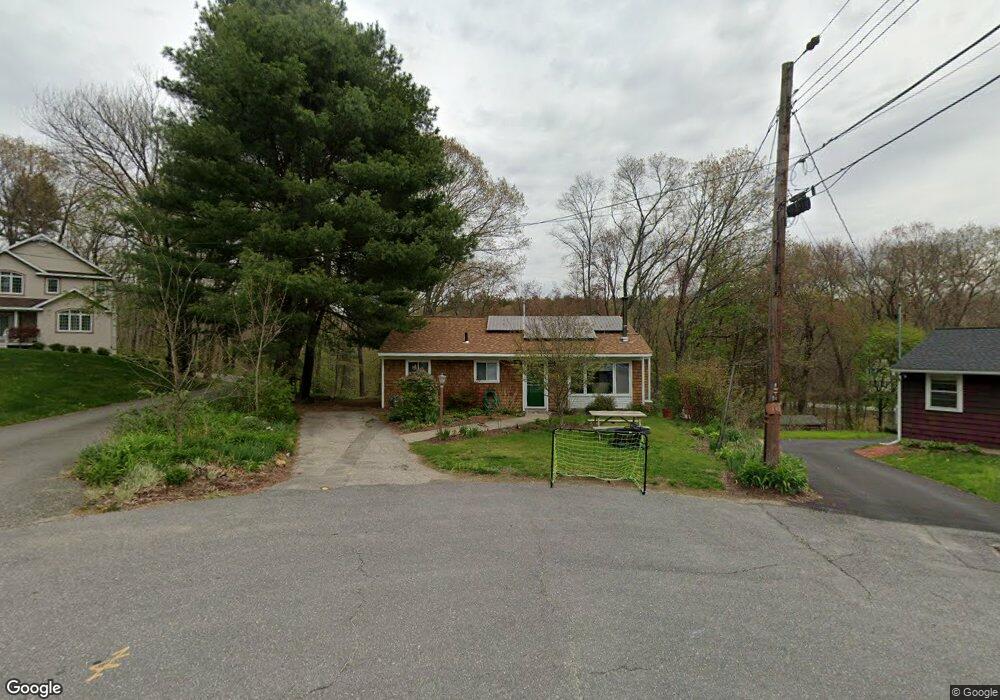
This home is located at 15 Lilac Ct, Acton, MA 01720 and is currently estimated at $657,951, approximately $494 per square foot. 15 Lilac Ct is a home located in Middlesex County with nearby schools including Acton-Boxborough Regional High School, Maynard Knowledge Beginnings, and The Imago School.
Ownership History
Date
Name
Owned For
Owner Type
Purchase Details
Closed on
Jan 4, 2023
Sold by
Nancy L Shippen T
Bought by
Shippen-How Pauravi B and Shippen-How Bharat
Current Estimated Value
Purchase Details
Closed on
Jul 23, 2021
Sold by
Shippen Nancy L
Bought by
Nancy L Shippen T
Purchase Details
Closed on
Jun 6, 1986
Bought by
Shippen Nancy
Create a Home Valuation Report for This Property
The Home Valuation Report is an in-depth analysis detailing your home's value as well as a comparison with similar homes in the area
Home Values in the Area
Average Home Value in this Area
Purchase History
| Date | Buyer | Sale Price | Title Company |
|---|---|---|---|
| Shippen-How Pauravi B | -- | None Available | |
| Nancy L Shippen T | -- | None Available | |
| Shippen Nancy | $125,000 | -- |
Source: Public Records
Mortgage History
| Date | Status | Borrower | Loan Amount |
|---|---|---|---|
| Previous Owner | Shippen Nancy | $91,000 | |
| Previous Owner | Shippen Nancy | $5,600 | |
| Previous Owner | Shippen Nancy | $99,000 | |
| Previous Owner | Shippen Nancy | $100,000 |
Source: Public Records
Tax History
| Year | Tax Paid | Tax Assessment Tax Assessment Total Assessment is a certain percentage of the fair market value that is determined by local assessors to be the total taxable value of land and additions on the property. | Land | Improvement |
|---|---|---|---|---|
| 2025 | $9,290 | $541,700 | $315,800 | $225,900 |
| 2024 | $8,858 | $531,400 | $315,800 | $215,600 |
| 2023 | $7,920 | $451,000 | $286,900 | $164,100 |
| 2022 | $7,926 | $407,500 | $249,300 | $158,200 |
| 2021 | $7,325 | $362,100 | $231,000 | $131,100 |
| 2020 | $7,142 | $371,200 | $231,000 | $140,200 |
| 2019 | $6,756 | $348,800 | $231,000 | $117,800 |
| 2018 | $6,436 | $332,100 | $231,000 | $101,100 |
| 2017 | $6,330 | $332,100 | $231,000 | $101,100 |
| 2016 | $6,159 | $320,300 | $231,000 | $89,300 |
| 2015 | $6,123 | $321,400 | $231,000 | $90,400 |
| 2014 | $6,469 | $332,600 | $231,000 | $101,600 |
Source: Public Records
Map
Nearby Homes
- 70 River St
- 1 Vanderbelt Rd
- 7 Hillcrest Dr
- 30 Brewster Ln
- 40 High St
- 25 Nylander Way
- 129 Main St Unit 129
- 131 Main St
- 128 Parker St Unit 3B
- 184 Main St Unit 3
- 7 Kelley Rd
- 31 Drummer Rd Unit 31
- 1 Drummer Rd Unit A5
- 246 Main St Unit 2
- 59 Lexington Dr
- 27 Forest Rd
- 46 Taylor Rd
- 63 Conant St
- 303 School St
- 18 Hayward Rd
Your Personal Tour Guide
Ask me questions while you tour the home.