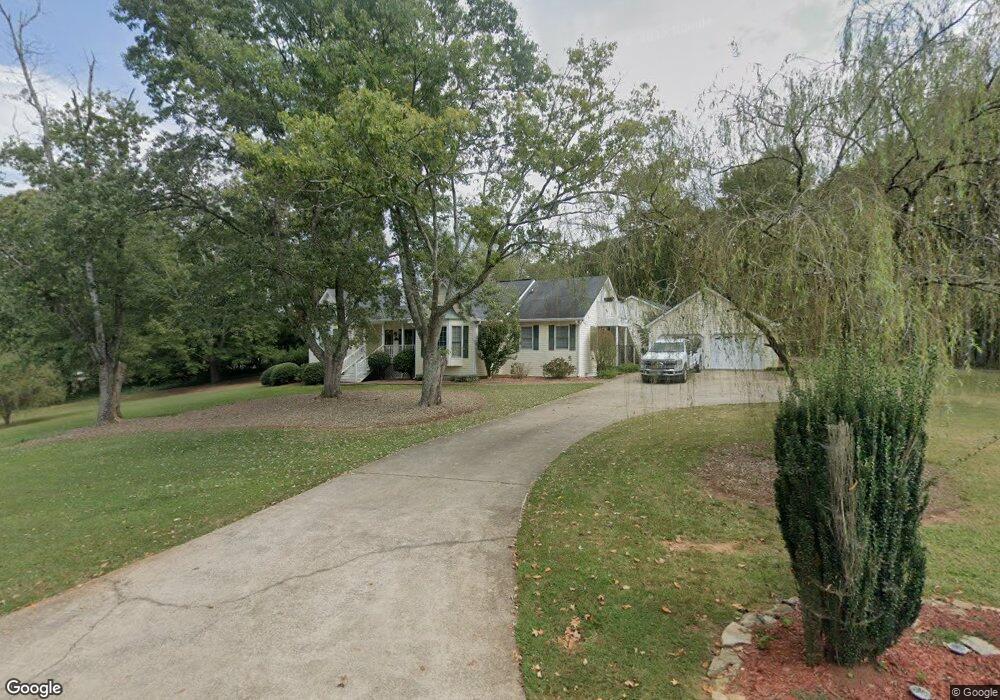
15 Logan Ridge Dr Unit 1 Carrollton, GA 30116
Estimated Value: $450,000 - $543,000
4
Beds
4
Baths
2,486
Sq Ft
$198/Sq Ft
Est. Value
About This Home
This home is located at 15 Logan Ridge Dr Unit 1, Carrollton, GA 30116 and is currently estimated at $491,170, approximately $197 per square foot. 15 Logan Ridge Dr Unit 1 is a home located in Carroll County with nearby schools including Central Elementary School, Central Middle School, and Central High School.
Ownership History
Date
Name
Owned For
Owner Type
Purchase Details
Closed on
Nov 24, 2015
Sold by
Lumpkin M Travis
Bought by
Montfort William R
Current Estimated Value
Home Financials for this Owner
Home Financials are based on the most recent Mortgage that was taken out on this home.
Original Mortgage
$204,000
Outstanding Balance
$160,674
Interest Rate
3.83%
Mortgage Type
New Conventional
Estimated Equity
$330,496
Purchase Details
Closed on
Jul 24, 2008
Sold by
Not Provided
Bought by
Lumpkin M Travis and Lumpkin Patricia B
Home Financials for this Owner
Home Financials are based on the most recent Mortgage that was taken out on this home.
Original Mortgage
$210,000
Interest Rate
6.43%
Mortgage Type
New Conventional
Purchase Details
Closed on
Sep 26, 2003
Sold by
Baker Bobby and Baker Cynthia
Bought by
Cheatwood Leah S and Cheatwood Shannon W
Purchase Details
Closed on
Jan 19, 1990
Bought by
Baker Bobby and Baker Cynthia
Create a Home Valuation Report for This Property
The Home Valuation Report is an in-depth analysis detailing your home's value as well as a comparison with similar homes in the area
Home Values in the Area
Average Home Value in this Area
Purchase History
| Date | Buyer | Sale Price | Title Company |
|---|---|---|---|
| Montfort William R | $255,000 | -- | |
| Lumpkin M Travis | $300,000 | -- | |
| Cheatwood Leah S | $199,000 | -- | |
| Baker Bobby | $112,800 | -- |
Source: Public Records
Mortgage History
| Date | Status | Borrower | Loan Amount |
|---|---|---|---|
| Open | Montfort William R | $204,000 | |
| Previous Owner | Lumpkin M Travis | $210,000 |
Source: Public Records
Tax History Compared to Growth
Tax History
| Year | Tax Paid | Tax Assessment Tax Assessment Total Assessment is a certain percentage of the fair market value that is determined by local assessors to be the total taxable value of land and additions on the property. | Land | Improvement |
|---|---|---|---|---|
| 2024 | $3,856 | $170,474 | $19,980 | $150,494 |
| 2023 | $3,856 | $158,986 | $19,980 | $139,006 |
| 2022 | $3,302 | $131,641 | $19,980 | $111,661 |
| 2021 | $3,035 | $118,366 | $19,980 | $98,386 |
| 2020 | $2,695 | $104,980 | $19,980 | $85,000 |
| 2019 | $2,560 | $98,941 | $19,980 | $78,961 |
| 2018 | $2,406 | $91,626 | $19,980 | $71,646 |
| 2017 | $2,413 | $91,626 | $19,980 | $71,646 |
| 2016 | $2,414 | $91,626 | $19,980 | $71,646 |
| 2015 | $2,341 | $83,700 | $8,000 | $75,700 |
| 2014 | $2,350 | $83,700 | $8,000 | $75,700 |
Source: Public Records
Map
Nearby Homes
- 484 Carrie Kathleen Terrace
- 472 Carrie Kathleen Terrace
- 221 Valley Ridge Dr
- 1915 Whooping Creek Church Rd
- 0 Lowell Rd Unit 10640679
- 1520 Whooping Creek Church Rd
- 1512 Whooping Creek Church Rd
- 1502 Whooping Creek Church Rd
- 1450 Whooping Creek Church Rd
- 135 Gray Rd
- 1430 Whooping Creek Church Rd
- 0 Ringer Rd Unit 10595950
- 1233 Whooping Creek Rd
- 2492 Oak Grove Church Rd
- 1001 Whooping Creek Rd
- 605 Whooping Creek Rd
- 500 Coleman Mill Rd
- 15 Logan Ridge Dr
- 0 Logan Ridge Dr Unit 7080803
- 0 Logan Ridge Dr Unit 7171190
- 15 Logan
- 35 Logan Ridge Dr
- 10 Logan Ridge Dr
- 338 Valley Ridge Dr
- 2115 Whooping Creek Church Rd
- 47 Logan Ridge Dr
- 62 Logan Ridge Dr
- 320 Valley Ridge Dr Unit 30
- 320 Valley Ridge Dr
- 311 Valley Ridge Dr
- 59 Logan Ridge Dr
- 308 Valley Ridge Dr
- 308 Valley Ridge Dr Unit 31
- 86 Logan Ridge Unit 27
- 86 Logan Ridge Dr Unit 27
- 86 Logan Ridge Dr
- 73 Logan Ridge Dr