Estimated Value: $261,693 - $338,000
--
Bed
1
Bath
2,059
Sq Ft
$149/Sq Ft
Est. Value
About This Home
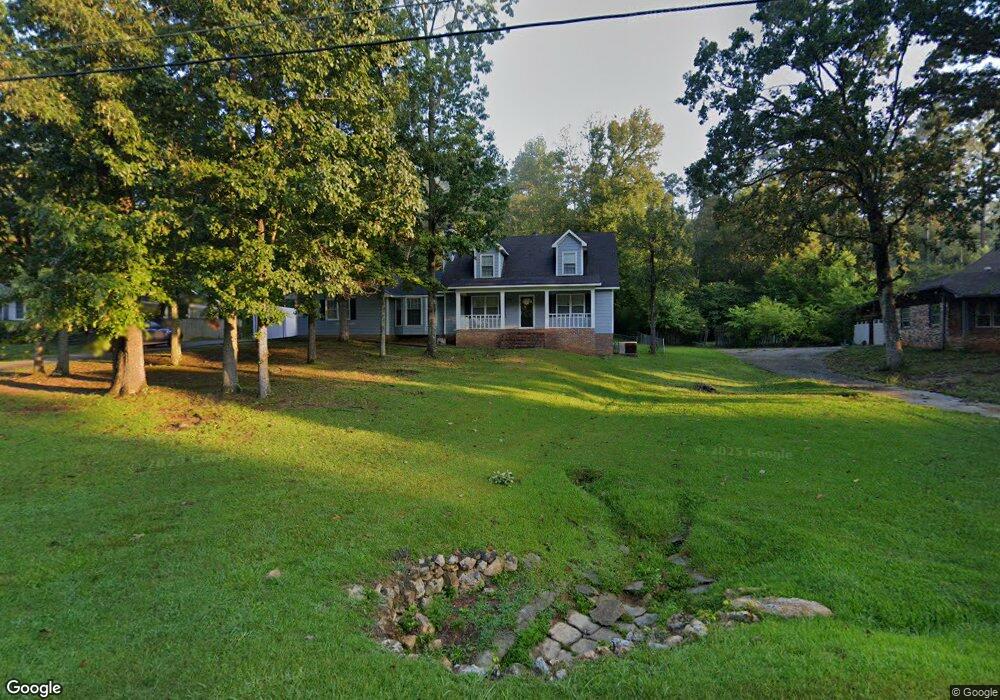
This home is located at 15 London Ln SE, Rome, GA 30161 and is currently estimated at $306,923, approximately $149 per square foot. 15 London Ln SE is a home located in Floyd County with nearby schools including Pepperell Middle School, Pepperell High School, and Montessori School of Rome.
Ownership History
Date
Name
Owned For
Owner Type
Purchase Details
Closed on
Sep 19, 2000
Sold by
Chumley Dennis and Chumley Betty J
Bought by
Pullen Luther and Chalice Pullen
Current Estimated Value
Purchase Details
Closed on
Feb 6, 1986
Sold by
Jones Warren Wilson and Jones Diane S
Bought by
Chumley Dennis and Chumley Betty J
Purchase Details
Closed on
Jul 29, 1985
Sold by
Stowe Gary L and Stowe Nancy H
Bought by
Jones Warren Wilson and Jones Diane S
Purchase Details
Closed on
Feb 19, 1982
Sold by
Equitable Life Assurance Socity Of The U
Bought by
Stowe Gary L and Stowe Nancy H
Purchase Details
Closed on
Jan 27, 1982
Sold by
Stone Geo G and Amy Klein
Bought by
Equitable Life Assurance Socity Of The U
Purchase Details
Closed on
Jun 14, 1976
Sold by
N R S Properties Inc
Bought by
Stone Geo G and Amy Klein
Purchase Details
Closed on
Jun 12, 1975
Bought by
N R S Properties Inc
Create a Home Valuation Report for This Property
The Home Valuation Report is an in-depth analysis detailing your home's value as well as a comparison with similar homes in the area
Home Values in the Area
Average Home Value in this Area
Purchase History
| Date | Buyer | Sale Price | Title Company |
|---|---|---|---|
| Pullen Luther | $148,500 | -- | |
| Chumley Dennis | $73,000 | -- | |
| Jones Warren Wilson | $68,000 | -- | |
| Stowe Gary L | $61,500 | -- | |
| Equitable Life Assurance Socity Of The U | $63,800 | -- | |
| Stone Geo G | $49,500 | -- | |
| N R S Properties Inc | -- | -- |
Source: Public Records
Tax History Compared to Growth
Tax History
| Year | Tax Paid | Tax Assessment Tax Assessment Total Assessment is a certain percentage of the fair market value that is determined by local assessors to be the total taxable value of land and additions on the property. | Land | Improvement |
|---|---|---|---|---|
| 2024 | $2,403 | $98,254 | $8,650 | $89,604 |
| 2023 | $2,482 | $90,938 | $7,632 | $83,306 |
| 2022 | $2,195 | $76,900 | $6,106 | $70,794 |
| 2021 | $2,121 | $70,990 | $6,106 | $64,884 |
| 2020 | $1,994 | $63,200 | $4,834 | $58,366 |
| 2019 | $1,620 | $56,893 | $4,834 | $52,059 |
| 2018 | $1,576 | $54,471 | $4,834 | $49,637 |
| 2017 | $1,558 | $53,322 | $4,834 | $48,488 |
| 2016 | $1,566 | $52,680 | $4,800 | $47,880 |
| 2015 | $1,566 | $54,276 | $4,800 | $49,476 |
| 2014 | $1,566 | $54,276 | $4,800 | $49,476 |
Source: Public Records
Map
Nearby Homes
- 0 Warwick Way SE Unit 10624495
- 0 Warwick Way SE Unit 7666193
- 111 Warwick Way SE
- 113 Warwick Way SE
- 85 Cambridge Dr SE
- 18 Devonshire Dr SE
- 11 Cambridge Dr SE
- 0 Camelot Cir SE Unit 7662985
- 0 Camelot Cir SE Unit 10621392
- 7 Rushden Way SE
- 3 Rushden Way SE
- 0 Wellington Way SE Unit 7374602
- 0 Wellington Way SE Unit 20180068
- 0 Wellington Way SE Unit 7374604
- 0 Wellington Way SE Unit 20180069
- 52 Twickenham Rd SE
- 28 Rushden Way SE
- 30 Rushden Way SE
- 9 Wellington Way SE
- 14 Wellington Way SE
- 17 London Ln SE
- 13 London Ln SE
- 12 Warwick Way SE
- 19 London Ln SE
- 11 London Ln SE
- 16 London Ln SE
- 10 Warwick Way SE Unit 37
- 10 Warwick Way SE
- 18 London Ln SE
- 18 Warwick Way SE
- 12 London Ln SE
- 9 London Ln SE
- 9 London Ln SE
- 9 London Ln SE Unit 22-23
- 21 London Ln SE
- 20 London Ln SE
- 0 London Ln SE Unit 7296724
- 6 Macbeth Ct SE
- 10 London Ln SE
- 15 Warwick Way SE Unit 48