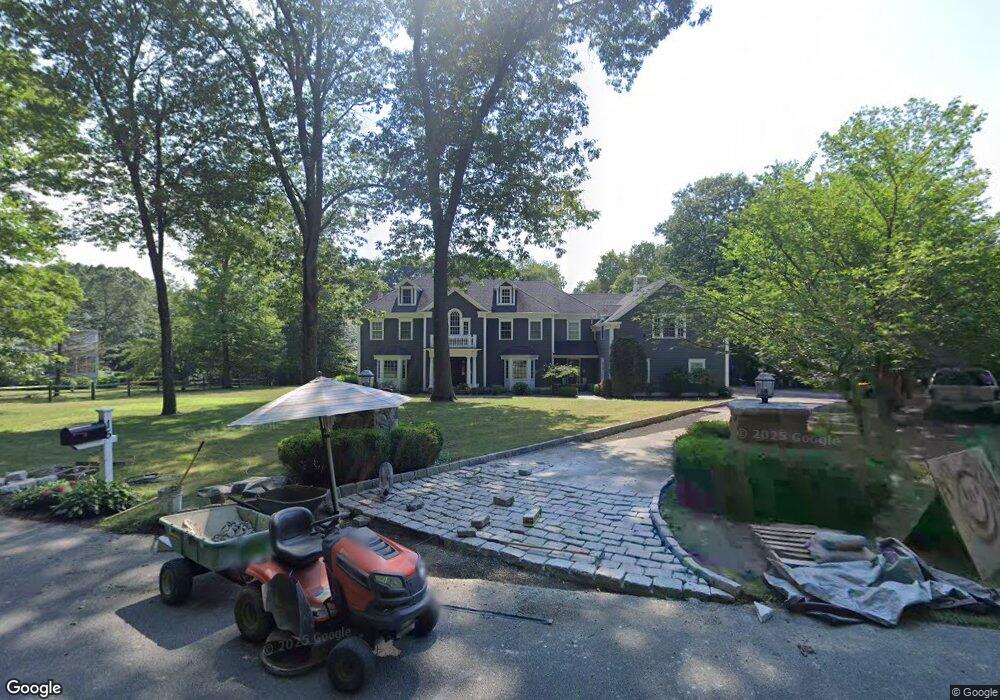
15 Long Wall Rd Redding, CT 06896
Estimated Value: $1,496,017 - $1,719,000
4
Beds
7
Baths
5,601
Sq Ft
$285/Sq Ft
Est. Value
About This Home
This home is located at 15 Long Wall Rd, Redding, CT 06896 and is currently estimated at $1,593,504, approximately $284 per square foot. 15 Long Wall Rd is a home located in Fairfield County with nearby schools including Redding Elementary School, John Read Middle School, and Joel Barlow High School.
Ownership History
Date
Name
Owned For
Owner Type
Purchase Details
Closed on
Sep 16, 2020
Sold by
Simpson Howard E and Simpson Joanne K
Bought by
Fenzel Michael R and Compeau Fenzel C
Current Estimated Value
Home Financials for this Owner
Home Financials are based on the most recent Mortgage that was taken out on this home.
Original Mortgage
$600,000
Outstanding Balance
$412,694
Interest Rate
2.9%
Mortgage Type
New Conventional
Estimated Equity
$1,180,810
Purchase Details
Closed on
Oct 24, 2013
Sold by
Simpson 3Rd Howard E
Bought by
Simpson Joanne K and Simpson Howard E
Purchase Details
Closed on
Sep 3, 2009
Sold by
Simpson Joanne K
Bought by
Simpson 3Rd Howard E
Purchase Details
Closed on
Mar 30, 2000
Sold by
Herman Stuart A
Bought by
Simpson Joanne K and Simpson Howard E
Create a Home Valuation Report for This Property
The Home Valuation Report is an in-depth analysis detailing your home's value as well as a comparison with similar homes in the area
Home Values in the Area
Average Home Value in this Area
Purchase History
| Date | Buyer | Sale Price | Title Company |
|---|---|---|---|
| Fenzel Michael R | -- | None Available | |
| Simpson Joanne K | -- | -- | |
| Simpson 3Rd Howard E | -- | -- | |
| Simpson Joanne K | $240,000 | -- |
Source: Public Records
Mortgage History
| Date | Status | Borrower | Loan Amount |
|---|---|---|---|
| Open | Fenzel Michael R | $600,000 | |
| Previous Owner | Simpson Joanne K | $145,000 | |
| Previous Owner | Simpson Joanne K | $100,000 |
Source: Public Records
Tax History
| Year | Tax Paid | Tax Assessment Tax Assessment Total Assessment is a certain percentage of the fair market value that is determined by local assessors to be the total taxable value of land and additions on the property. | Land | Improvement |
|---|---|---|---|---|
| 2025 | $24,515 | $829,900 | $182,700 | $647,200 |
| 2024 | $23,835 | $829,900 | $182,700 | $647,200 |
| 2023 | $22,980 | $829,900 | $182,700 | $647,200 |
| 2022 | $22,238 | $667,000 | $197,300 | $469,700 |
| 2021 | $21,904 | $667,000 | $197,300 | $469,700 |
| 2020 | $21,904 | $667,000 | $197,300 | $469,700 |
| 2019 | $21,904 | $667,000 | $197,300 | $469,700 |
| 2018 | $21,157 | $667,000 | $197,300 | $469,700 |
| 2017 | $29,653 | $1,001,100 | $235,700 | $765,400 |
| 2016 | $29,272 | $1,001,100 | $235,700 | $765,400 |
| 2015 | $28,942 | $1,001,100 | $235,700 | $765,400 |
| 2014 | $28,942 | $1,001,100 | $235,700 | $765,400 |
Source: Public Records
Map
Nearby Homes
- 7 Long Meadow Ln
- 41 Deer Hill Rd
- 241 Black Rock Turnpike
- 45 Great Pasture Rd
- 63 Turney Rd
- 2 Longwood Dr
- 299 Redding Rd
- 36 Fox Run Rd
- 22 Ledgewood Rd
- 54 Rock House Rd
- 24 Costa Ln
- 429 Rock House Rd
- 235 Rock House Rd
- 219 Redding Rd
- 229 Umpawaug Rd
- 41 Ridge Line Rd
- 294 Maple Rd
- 123A Peaceable St
- 2 Brick School Dr
- 193 Chestnut Ridge Rd
- 13 Long Wall Rd
- 17 Long Wall Rd
- 11 Long Wall Rd
- 19 Long Wall Rd
- 11 Tunxis Trail
- 5 Long Wall Rd
- 9 Long Wall Rd
- 271 Newtown Turnpike
- 21 Long Wall Rd
- 4 Long Wall Rd
- 3 Long Wall Rd
- 19 Tunxis Trail
- 9 Tunxis Trail
- 279 Newtown Turnpike
- 22 Long Wall Rd
- 23 Long Wall Rd
- 21 Tunxis Trail
- 281 Newtown Turnpike
- 17 Tunxis Trail
- 4 Tunxis Trail
Your Personal Tour Guide
Ask me questions while you tour the home.