
Seller's Agent in 2022
Christopher Davis
Real Broker
(207) 756-2442
3 in this area
138 Total Sales


Estimated Value: $714,000 - $900,145
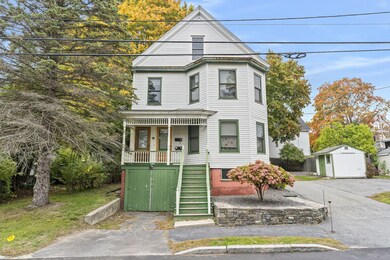
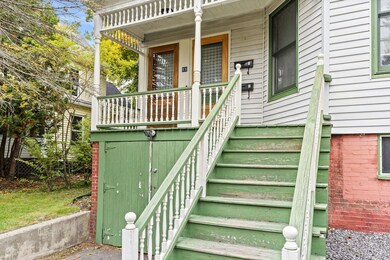
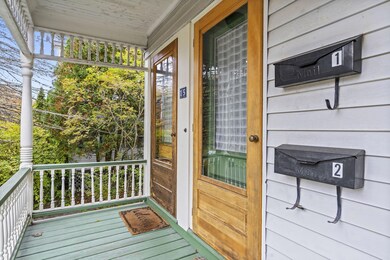
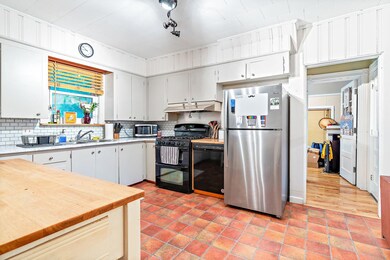
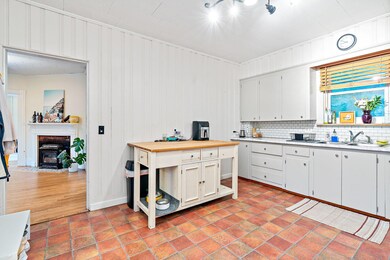
15 Mabel Street is a spacious two-unit tucked back into the heart of Deering Center and features strong rental history, with welcoming layouts. The first floor unit features a large bedroom, dining room with a gas fireplace, large living room and a bonus back office space. An owner occupant will appreciate the private farmer's porch entrance, setback from the road, that looks out to the raised beds. The 3 bedroom unit on floors 2 and 3, has consistently been rented out to university students and features in-unit laundry and it's own deck. The building has a brand new natural gas boiler, hardwood floors throughout, large basement with walk-out access and a convenient location to all of Deering Center's hotspots. Group showings will be held Friday from 4-6 pm and Saturday from 12-2 pm.
Last Agent to Sell the Property
Real Broker Brokerage Phone: 207-756-2442 Listed on: 10/19/2022
| Date | Buyer | Sale Price | Title Company |
|---|---|---|---|
| Harrington Amy | $635,000 | None Available | |
| Harrington Amy | $635,000 | None Available | |
| Lariviere Jillian M | -- | -- | |
| Lariviere Jillian M | -- | -- | |
| Lariviere Jillian M | -- | -- | |
| Lariviere Jillian M | -- | -- |
| Date | Status | Borrower | Loan Amount |
|---|---|---|---|
| Open | Harrington Amy | $508,000 | |
| Closed | Harrington Amy | $508,000 | |
| Previous Owner | Lariviere Jillian M | $324,022 |
| Date | Event | Price | List to Sale | Price per Sq Ft | Prior Sale |
|---|---|---|---|---|---|
| 12/05/2022 12/05/22 | Sold | $635,000 | +0.8% | $262 / Sq Ft | |
| 10/24/2022 10/24/22 | Pending | -- | -- | -- | |
| 10/19/2022 10/19/22 | For Sale | $630,000 | +90.9% | $260 / Sq Ft | |
| 08/04/2015 08/04/15 | Sold | $330,000 | +3.2% | $136 / Sq Ft | View Prior Sale |
| 06/21/2015 06/21/15 | Pending | -- | -- | -- | |
| 06/17/2015 06/17/15 | For Sale | $319,900 | -- | $132 / Sq Ft |
| Year | Tax Paid | Tax Assessment Tax Assessment Total Assessment is a certain percentage of the fair market value that is determined by local assessors to be the total taxable value of land and additions on the property. | Land | Improvement |
|---|---|---|---|---|
| 2024 | $7,169 | $477,600 | $94,000 | $383,600 |
| 2023 | $6,882 | $477,600 | $94,000 | $383,600 |
| 2022 | $6,500 | $477,600 | $94,000 | $383,600 |
| 2021 | $6,204 | $477,600 | $94,000 | $383,600 |
| 2020 | $5,988 | $256,900 | $88,500 | $168,400 |
| 2019 | $5,988 | $256,900 | $88,500 | $168,400 |
| 2018 | $5,775 | $256,900 | $88,500 | $168,400 |
| 2017 | $5,562 | $256,900 | $88,500 | $168,400 |
| 2016 | $5,423 | $256,900 | $88,500 | $168,400 |
| 2015 | $5,300 | $256,900 | $88,500 | $168,400 |
| 2014 | $5,138 | $256,900 | $88,500 | $168,400 |
Seller's Agent in 2022
Christopher Davis
Real Broker
(207) 756-2442
3 in this area
138 Total Sales
K
Buyer's Agent in 2022
Kaleb Swan
Legacy Properties Sotheby's International Realty
(207) 653-0924
1 in this area
39 Total Sales
S
Seller's Agent in 2015
Sue Meservier
Bean Group
M
Seller Co-Listing Agent in 2015
Matthew Freedman
Bean Group
D
Buyer's Agent in 2015
Dava Davin
Portside Real Estate Group
(207) 217-2051
4 Total Sales
Source: Maine Listings
MLS Number: 1546239
APN: PTLD-000133-000000-C009001
Disclaimer: Certain information contained herein is derived from information provided by parties other than Homes.com. All information provided is deemed reliable, but is not guaranteed to be accurate and should be independently verified.
![]() Listing data is derived in whole or in part from Maine Real Estate Information System, Inc. (d/b/a Maine Listings) and is for consumers' personal, noncommercial use only. Dimensions are approximate and not guaranteed. All data should be independently verified.
Listing data is derived in whole or in part from Maine Real Estate Information System, Inc. (d/b/a Maine Listings) and is for consumers' personal, noncommercial use only. Dimensions are approximate and not guaranteed. All data should be independently verified.
© 2025 Maine Real Estate Information System, Inc. All Rights Reserved. Equal Housing Opportunity.
Homes.com, LLC, 17600 Laguna Canyon Rd Irvine, CA 92618 (888)-952-6393
![]()