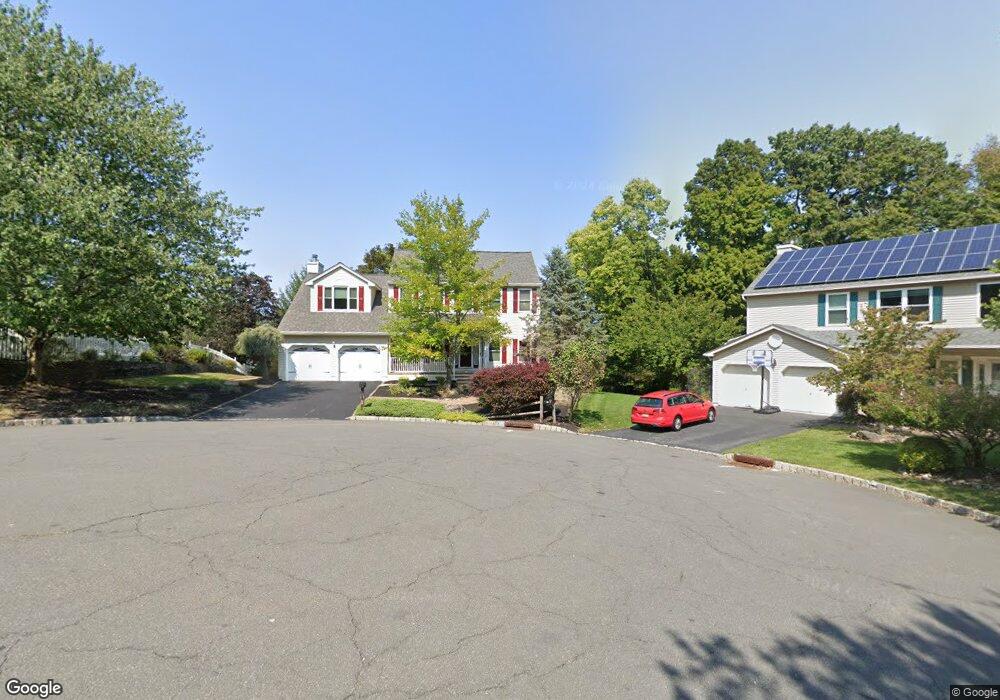
15 Manning Ct High Bridge, NJ 08829
Estimated Value: $600,000 - $619,184
--
Bed
--
Bath
2,310
Sq Ft
$265/Sq Ft
Est. Value
About This Home
This home is located at 15 Manning Ct, High Bridge, NJ 08829 and is currently estimated at $611,796, approximately $264 per square foot. 15 Manning Ct is a home located in Hunterdon County with nearby schools including High Bridge Elementary School, High Bridge Middle School, and Voorhees High School.
Ownership History
Date
Name
Owned For
Owner Type
Purchase Details
Closed on
Dec 21, 2018
Sold by
Raskin Phyllis W and The Phyllis W Raskin Living Tr
Bought by
Raskin Neil R and Raskin Phyllis W
Current Estimated Value
Purchase Details
Closed on
Feb 10, 2012
Sold by
Raskin Neil R and Raskin Phyllis
Bought by
Raskin Phyllis W
Purchase Details
Closed on
Feb 5, 1998
Sold by
Heilands Llc
Bought by
Raskin Neil R and Raskin Phyllis
Home Financials for this Owner
Home Financials are based on the most recent Mortgage that was taken out on this home.
Original Mortgage
$120,000
Outstanding Balance
$21,149
Interest Rate
6.95%
Estimated Equity
$590,647
Create a Home Valuation Report for This Property
The Home Valuation Report is an in-depth analysis detailing your home's value as well as a comparison with similar homes in the area
Home Values in the Area
Average Home Value in this Area
Purchase History
| Date | Buyer | Sale Price | Title Company |
|---|---|---|---|
| Raskin Neil R | -- | None Available | |
| Raskin Phyllis W | -- | None Available | |
| Raskin Neil R | $257,459 | -- |
Source: Public Records
Mortgage History
| Date | Status | Borrower | Loan Amount |
|---|---|---|---|
| Open | Raskin Neil R | $120,000 |
Source: Public Records
Tax History Compared to Growth
Tax History
| Year | Tax Paid | Tax Assessment Tax Assessment Total Assessment is a certain percentage of the fair market value that is determined by local assessors to be the total taxable value of land and additions on the property. | Land | Improvement |
|---|---|---|---|---|
| 2025 | $15,710 | $531,200 | $208,100 | $323,100 |
| 2024 | $14,954 | $481,300 | $141,800 | $339,500 |
| 2023 | $14,954 | $378,200 | $113,100 | $265,100 |
| 2022 | $15,637 | $367,500 | $100,800 | $266,700 |
| 2021 | $15,256 | $367,600 | $100,800 | $266,800 |
| 2020 | $15,080 | $367,800 | $100,800 | $267,000 |
| 2019 | $15,256 | $369,300 | $100,800 | $268,500 |
| 2018 | $14,695 | $370,800 | $100,800 | $270,000 |
| 2017 | $14,653 | $380,200 | $105,800 | $274,400 |
| 2016 | $14,482 | $380,200 | $105,800 | $274,400 |
| 2015 | $14,090 | $380,200 | $105,800 | $274,400 |
| 2014 | $12,694 | $370,200 | $107,400 | $262,800 |
Source: Public Records
Map
Nearby Homes