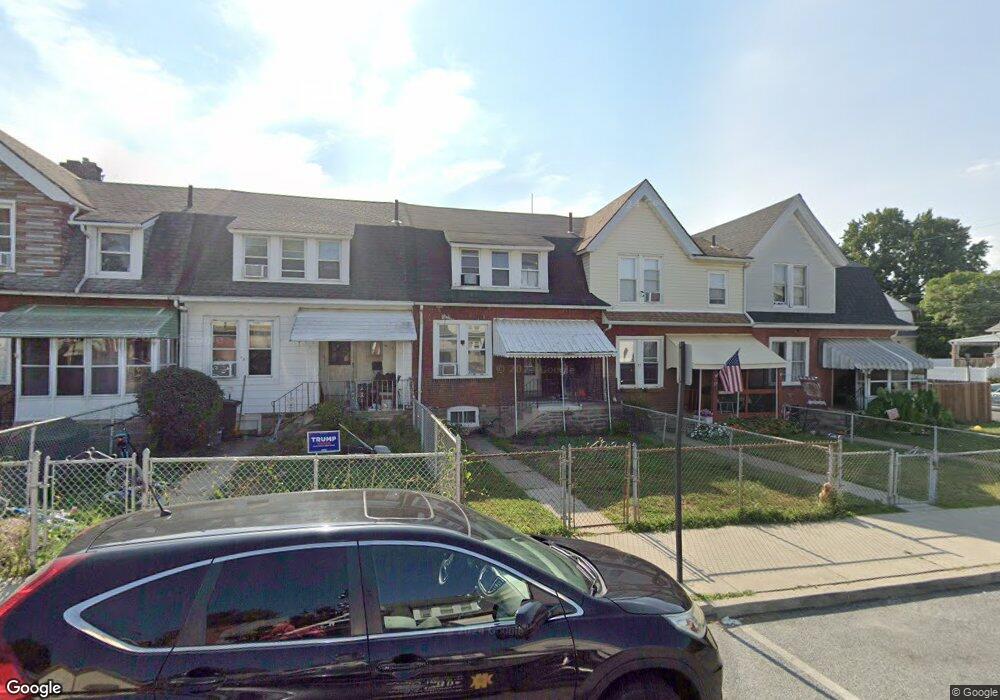
15 Maple St Marcus Hook, PA 19061
Estimated Value: $140,000 - $170,000
3
Beds
1
Bath
1,080
Sq Ft
$147/Sq Ft
Est. Value
About This Home
This home is located at 15 Maple St, Marcus Hook, PA 19061 and is currently estimated at $158,285, approximately $146 per square foot. 15 Maple St is a home located in Delaware County with nearby schools including Chichester Senior High School, Chester Charter School for the Arts, and Frederick Douglass Christian School.
Ownership History
Date
Name
Owned For
Owner Type
Purchase Details
Closed on
Apr 28, 2006
Sold by
Newcomb Robert
Bought by
Hall Margaret C and Mcnamara Michael J
Current Estimated Value
Home Financials for this Owner
Home Financials are based on the most recent Mortgage that was taken out on this home.
Original Mortgage
$68,458
Outstanding Balance
$39,512
Interest Rate
6.34%
Mortgage Type
FHA
Estimated Equity
$118,773
Purchase Details
Closed on
Mar 7, 2005
Sold by
Newcomb Robert and Newcomb Michelle A
Bought by
Newcomb Michelle A
Create a Home Valuation Report for This Property
The Home Valuation Report is an in-depth analysis detailing your home's value as well as a comparison with similar homes in the area
Home Values in the Area
Average Home Value in this Area
Purchase History
| Date | Buyer | Sale Price | Title Company |
|---|---|---|---|
| Hall Margaret C | $69,000 | Commonwealth Land Title Insu | |
| Newcomb Michelle A | -- | -- |
Source: Public Records
Mortgage History
| Date | Status | Borrower | Loan Amount |
|---|---|---|---|
| Open | Hall Margaret C | $68,458 |
Source: Public Records
Tax History Compared to Growth
Tax History
| Year | Tax Paid | Tax Assessment Tax Assessment Total Assessment is a certain percentage of the fair market value that is determined by local assessors to be the total taxable value of land and additions on the property. | Land | Improvement |
|---|---|---|---|---|
| 2025 | $2,695 | $65,680 | $18,670 | $47,010 |
| 2024 | $2,695 | $65,680 | $18,670 | $47,010 |
| 2023 | $2,494 | $65,680 | $18,670 | $47,010 |
| 2022 | $2,376 | $65,680 | $18,670 | $47,010 |
| 2021 | $3,339 | $65,680 | $18,670 | $47,010 |
| 2020 | $2,965 | $51,410 | $17,290 | $34,120 |
| 2019 | $2,965 | $51,410 | $17,290 | $34,120 |
| 2018 | $2,972 | $51,410 | $0 | $0 |
| 2017 | $2,952 | $51,410 | $0 | $0 |
| 2016 | $282 | $51,410 | $0 | $0 |
| 2015 | $282 | $51,410 | $0 | $0 |
| 2014 | $282 | $51,410 | $0 | $0 |
Source: Public Records
Map
Nearby Homes