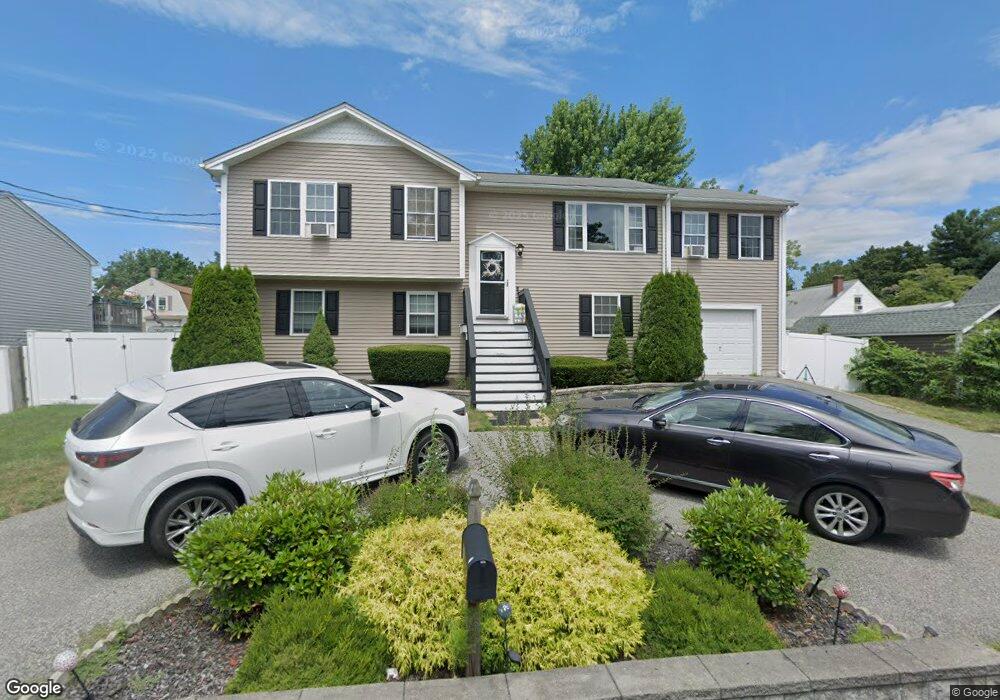
15 Marblehead St Warwick, RI 02889
Oakland Beach NeighborhoodEstimated Value: $390,000 - $449,000
4
Beds
1
Bath
1,360
Sq Ft
$317/Sq Ft
Est. Value
About This Home
This home is located at 15 Marblehead St, Warwick, RI 02889 and is currently estimated at $431,517, approximately $317 per square foot. 15 Marblehead St is a home located in Kent County with nearby schools including Saint Kevin School and Bishop Hendricken High School.
Ownership History
Date
Name
Owned For
Owner Type
Purchase Details
Closed on
Jan 19, 2018
Sold by
Barros Victor and Fontes-Barros Michelle
Bought by
Fontes-Barros Michelle
Current Estimated Value
Purchase Details
Closed on
Aug 28, 2013
Sold by
Fontes Shirley L
Bought by
Barros Victor and Fontes-Barros Michelle
Home Financials for this Owner
Home Financials are based on the most recent Mortgage that was taken out on this home.
Original Mortgage
$121,600
Interest Rate
4.4%
Mortgage Type
New Conventional
Purchase Details
Closed on
Oct 1, 2003
Sold by
Starbridge Home Bldrs
Bought by
Fontes Shirley L
Home Financials for this Owner
Home Financials are based on the most recent Mortgage that was taken out on this home.
Original Mortgage
$148,000
Interest Rate
6.25%
Mortgage Type
Purchase Money Mortgage
Create a Home Valuation Report for This Property
The Home Valuation Report is an in-depth analysis detailing your home's value as well as a comparison with similar homes in the area
Home Values in the Area
Average Home Value in this Area
Purchase History
| Date | Buyer | Sale Price | Title Company |
|---|---|---|---|
| Fontes-Barros Michelle | -- | -- | |
| Barros Victor | $152,000 | -- | |
| Fontes Shirley L | $185,000 | -- |
Source: Public Records
Mortgage History
| Date | Status | Borrower | Loan Amount |
|---|---|---|---|
| Previous Owner | Fontes Shirley L | $19,000 | |
| Previous Owner | Fontes Shirley L | $121,600 | |
| Previous Owner | Fontes Shirley L | $148,000 |
Source: Public Records
Tax History
| Year | Tax Paid | Tax Assessment Tax Assessment Total Assessment is a certain percentage of the fair market value that is determined by local assessors to be the total taxable value of land and additions on the property. | Land | Improvement |
|---|---|---|---|---|
| 2025 | $5,531 | $435,500 | $100,300 | $335,200 |
| 2024 | $5,506 | $380,500 | $82,900 | $297,600 |
| 2023 | $5,399 | $380,500 | $82,900 | $297,600 |
| 2022 | $5,087 | $271,600 | $46,300 | $225,300 |
| 2021 | $5,087 | $271,600 | $46,300 | $225,300 |
| 2020 | $5,087 | $271,600 | $46,300 | $225,300 |
| 2019 | $5,087 | $271,600 | $46,300 | $225,300 |
| 2018 | $4,407 | $217,800 | $46,300 | $171,500 |
| 2017 | $4,408 | $217,800 | $46,300 | $171,500 |
| 2016 | $4,408 | $217,800 | $46,300 | $171,500 |
| 2015 | $4,096 | $197,400 | $56,900 | $140,500 |
| 2014 | $3,960 | $197,400 | $56,900 | $140,500 |
| 2013 | $3,538 | $178,800 | $56,900 | $121,900 |
Source: Public Records
Map
Nearby Homes
- 15 Center Ct
- 585 Meadow View Ave
- 43 Beaver Ave
- 0 Meadow View Ave
- 195 Oakland Beach Ave
- 31 Oakhurst Ave
- 357 Warwick Neck Ave
- 73 Pinehurst Ave
- 71 Pinehurst Ave
- 21 Hampton Ave
- 79 Pinehurst Ave
- 81 Pinehurst Ave
- 75 Northup St
- 266 Vineyard Rd
- 9 Kenneth Ave
- 107 Coburn St
- 30 White Rock Rd
- 357 Pequot Ave
- 83 Ottawa Ave
- 170 Medford St
Your Personal Tour Guide
Ask me questions while you tour the home.