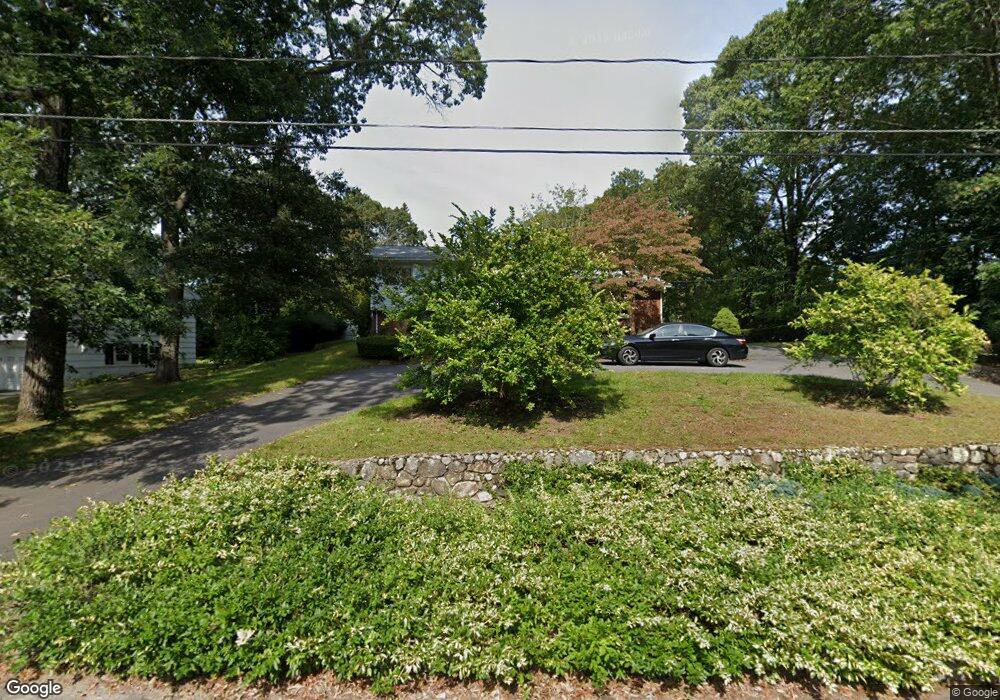
15 Marlene Ave Brockton, MA 02301
Estimated Value: $544,000 - $647,000
4
Beds
4
Baths
1,504
Sq Ft
$404/Sq Ft
Est. Value
About This Home
This home is located at 15 Marlene Ave, Brockton, MA 02301 and is currently estimated at $606,931, approximately $403 per square foot. 15 Marlene Ave is a home located in Plymouth County with nearby schools including Manthala George Jr. School, Hancock Elementary School, and Louis F Angelo Elementary School.
Ownership History
Date
Name
Owned For
Owner Type
Purchase Details
Closed on
Sep 11, 2006
Sold by
Souaiden Elias I and Souaide Charbel I
Bought by
Curry Michael A
Current Estimated Value
Home Financials for this Owner
Home Financials are based on the most recent Mortgage that was taken out on this home.
Original Mortgage
$319,200
Outstanding Balance
$192,942
Interest Rate
6.79%
Mortgage Type
Purchase Money Mortgage
Estimated Equity
$413,989
Purchase Details
Closed on
Feb 9, 2004
Sold by
Souaidan Elias I
Bought by
Souaiden Charbel I and Souaiden Aida A
Home Financials for this Owner
Home Financials are based on the most recent Mortgage that was taken out on this home.
Original Mortgage
$120,000
Interest Rate
5.8%
Mortgage Type
Purchase Money Mortgage
Purchase Details
Closed on
Jan 19, 1996
Sold by
Mantalos Timothy A and Mantalos James T
Bought by
Souaidan Elias T
Create a Home Valuation Report for This Property
The Home Valuation Report is an in-depth analysis detailing your home's value as well as a comparison with similar homes in the area
Home Values in the Area
Average Home Value in this Area
Purchase History
| Date | Buyer | Sale Price | Title Company |
|---|---|---|---|
| Curry Michael A | $399,000 | -- | |
| Souaiden Charbel I | $150,000 | -- | |
| Souaidan Elias T | $139,900 | -- |
Source: Public Records
Mortgage History
| Date | Status | Borrower | Loan Amount |
|---|---|---|---|
| Open | Souaidan Elias T | $319,200 | |
| Closed | Souaidan Elias T | $79,800 | |
| Previous Owner | Souaidan Elias T | $120,000 | |
| Previous Owner | Souaidan Elias T | $159,810 |
Source: Public Records
Tax History Compared to Growth
Tax History
| Year | Tax Paid | Tax Assessment Tax Assessment Total Assessment is a certain percentage of the fair market value that is determined by local assessors to be the total taxable value of land and additions on the property. | Land | Improvement |
|---|---|---|---|---|
| 2025 | $6,578 | $543,200 | $160,500 | $382,700 |
| 2024 | $6,349 | $528,200 | $160,500 | $367,700 |
| 2023 | $5,931 | $456,900 | $126,500 | $330,400 |
| 2022 | $5,535 | $396,200 | $115,500 | $280,700 |
| 2021 | $5,503 | $379,500 | $104,800 | $274,700 |
| 2020 | $5,606 | $370,000 | $100,400 | $269,600 |
| 2019 | $5,939 | $382,200 | $93,500 | $288,700 |
| 2018 | $5,292 | $329,500 | $93,500 | $236,000 |
| 2017 | $4,904 | $304,600 | $93,500 | $211,100 |
| 2016 | $4,863 | $280,100 | $85,400 | $194,700 |
| 2015 | $4,583 | $252,500 | $85,400 | $167,100 |
| 2014 | $4,529 | $249,800 | $85,400 | $164,400 |
Source: Public Records
Map
Nearby Homes
- 25 Monson St
- 37 West St
- 28 Fern Ave
- 48 N Belcher Ave
- 17 Moraine Place
- 20 Montauk Rd
- 67 Sycamore Ave Unit 3
- 21 Oneida Ave
- 161 Moraine St
- 72 W Elm Terrace
- 77 Colonel Bell Dr Unit 4
- 61 Fairfield St
- 141 Prospect Ave
- 175 Belmont Ave
- 281 Spring St
- 15 Byron Ave
- 190 Highland St
- 114 Crickett Rd
- 45 Cross St
- 45 Briarcliff Rd