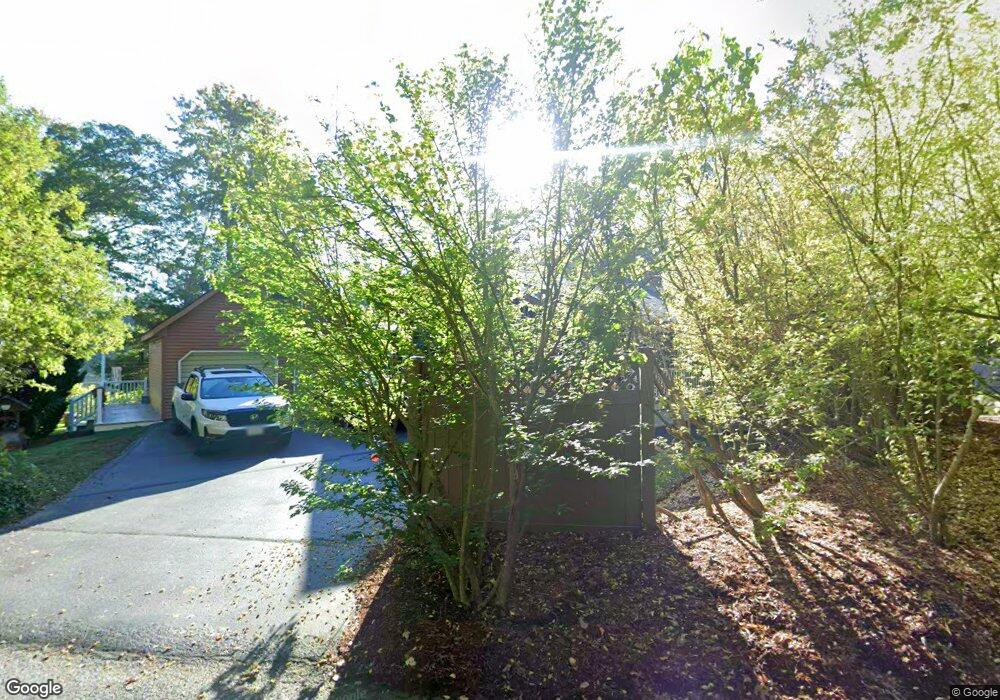
15 Marshall Way Rehoboth, MA 02769
Estimated Value: $251,000 - $657,000
2
Beds
2
Baths
2,004
Sq Ft
$266/Sq Ft
Est. Value
About This Home
This home is located at 15 Marshall Way, Rehoboth, MA 02769 and is currently estimated at $533,568, approximately $266 per square foot. 15 Marshall Way is a home located in Bristol County with nearby schools including Dighton-Rehoboth Regional High School and Cedar Brook School.
Ownership History
Date
Name
Owned For
Owner Type
Purchase Details
Closed on
Nov 30, 2012
Sold by
Recupero Michael A and Recupero Nancy J
Bought by
Minan T and Recupero Michael A
Current Estimated Value
Purchase Details
Closed on
Feb 25, 1987
Sold by
Cardono Mark
Bought by
Nye Orren
Create a Home Valuation Report for This Property
The Home Valuation Report is an in-depth analysis detailing your home's value as well as a comparison with similar homes in the area
Home Values in the Area
Average Home Value in this Area
Purchase History
| Date | Buyer | Sale Price | Title Company |
|---|---|---|---|
| Minan T | -- | -- | |
| Nye Orren | $186,900 | -- |
Source: Public Records
Mortgage History
| Date | Status | Borrower | Loan Amount |
|---|---|---|---|
| Previous Owner | Nye Orren | $137,000 | |
| Previous Owner | Nye Orren | $105,000 | |
| Previous Owner | Nye Orren | $115,500 | |
| Previous Owner | Nye Orren | $103,600 |
Source: Public Records
Tax History Compared to Growth
Tax History
| Year | Tax Paid | Tax Assessment Tax Assessment Total Assessment is a certain percentage of the fair market value that is determined by local assessors to be the total taxable value of land and additions on the property. | Land | Improvement |
|---|---|---|---|---|
| 2025 | $56 | $505,900 | $172,800 | $333,100 |
| 2024 | $5,727 | $504,100 | $207,400 | $296,700 |
| 2023 | $5,313 | $458,800 | $203,000 | $255,800 |
| 2022 | $5,086 | $401,400 | $186,100 | $215,300 |
| 2021 | $4,837 | $365,300 | $169,500 | $195,800 |
| 2020 | $4,721 | $359,800 | $177,500 | $182,300 |
| 2018 | $3,428 | $350,700 | $169,000 | $181,700 |
| 2017 | $3,912 | $311,500 | $169,000 | $142,500 |
| 2016 | $3,792 | $312,100 | $176,600 | $135,500 |
| 2015 | $3,598 | $292,300 | $168,400 | $123,900 |
| 2014 | $3,533 | $284,000 | $160,100 | $123,900 |
Source: Public Records
Map
Nearby Homes
- 67 Wheeler St
- 0 Winter St
- 23 Colonial Way
- 20 School St
- 37 Colonial Way
- 111 Summer St
- 9 Hidden Hills Dr
- 6 Running Stream Rd
- 15 Hickory Ridge Rd
- 25 Lincoln St
- 198 Brook St
- 16 Salisbury St
- 824 Taunton Ave
- 8 Linden Ln
- 8 Linden Ln
- 205 Providence St Bldr Lot 3
- 203 Providence St Bldr Lot 5
- 31 Woodland Way
- 420 Chestnut St
- 63 Moulton St