Estimated Value: $94,195 - $177,000
--
Bed
--
Bath
1,470
Sq Ft
$99/Sq Ft
Est. Value
About This Home
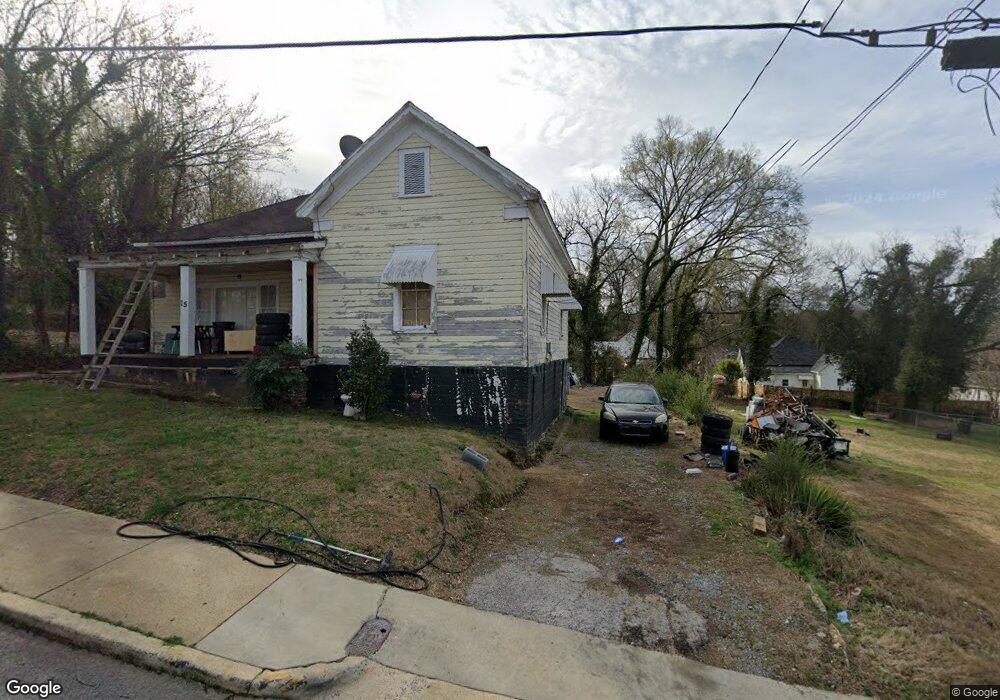
This home is located at 15 McGhee St SW, Rome, GA 30161 and is currently estimated at $144,799, approximately $98 per square foot. 15 McGhee St SW is a home located in Floyd County with nearby schools including Dan McCarty Middle School, Rome High School, and Darlington School.
Ownership History
Date
Name
Owned For
Owner Type
Purchase Details
Closed on
Jun 9, 1997
Sold by
Berry Albert E & Thomas Berry Iii & Mart
Bought by
Walstad Martha
Current Estimated Value
Purchase Details
Closed on
Dec 27, 1993
Sold by
Berry Mirtica R and Berry Albert E
Bought by
Berry Albert E and Thomas Berry
Purchase Details
Closed on
Jul 26, 1991
Sold by
Youngblood E B
Bought by
Berry Mirtica R and Berry Albert E
Purchase Details
Closed on
May 31, 1991
Sold by
Gowens Dorothy Mildren Hanson P and Gowens R
Bought by
Youngblood E B
Purchase Details
Closed on
Mar 24, 1977
Sold by
Baker Aj
Bought by
Gowens Dorothy Mildren Hanson P and Gowens R
Purchase Details
Closed on
Jan 1, 1973
Sold by
Langley Michael W
Bought by
Baker Aj
Purchase Details
Closed on
Jan 1, 1971
Sold by
Warren Wm L
Bought by
Langley Michael W
Purchase Details
Closed on
Jan 1, 1967
Sold by
Pyle Roy E
Bought by
Scarborough Daniel J
Purchase Details
Closed on
Jan 1, 1901
Bought by
Pyle Roy E
Create a Home Valuation Report for This Property
The Home Valuation Report is an in-depth analysis detailing your home's value as well as a comparison with similar homes in the area
Home Values in the Area
Average Home Value in this Area
Purchase History
| Date | Buyer | Sale Price | Title Company |
|---|---|---|---|
| Walstad Martha | $30,000 | -- | |
| Berry Albert E | -- | -- | |
| Berry Mirtica R | $17,600 | -- | |
| Youngblood E B | $10,000 | -- | |
| P | $12,900 | -- | |
| Gowens Dorothy Mildren Hanson P | -- | -- | |
| Baker Aj | -- | -- | |
| Langley Michael W | $9,900 | -- | |
| Warren Wm L | $11,000 | -- | |
| Scarborough Daniel J | -- | -- | |
| Pyle Roy E | -- | -- |
Source: Public Records
Tax History Compared to Growth
Tax History
| Year | Tax Paid | Tax Assessment Tax Assessment Total Assessment is a certain percentage of the fair market value that is determined by local assessors to be the total taxable value of land and additions on the property. | Land | Improvement |
|---|---|---|---|---|
| 2024 | $1,330 | $31,775 | $4,092 | $27,683 |
| 2023 | $1,125 | $30,111 | $3,720 | $26,391 |
| 2022 | $696 | $19,077 | $2,976 | $16,101 |
| 2021 | $635 | $17,113 | $2,976 | $14,137 |
| 2020 | $579 | $15,465 | $2,325 | $13,140 |
| 2019 | $536 | $14,483 | $2,325 | $12,158 |
| 2018 | $500 | $13,501 | $2,325 | $11,176 |
| 2017 | $478 | $12,909 | $2,325 | $10,584 |
| 2016 | $465 | $12,521 | $2,320 | $10,201 |
| 2015 | $439 | $12,521 | $2,320 | $10,201 |
| 2014 | $439 | $12,521 | $2,320 | $10,201 |
Source: Public Records
Map
Nearby Homes
- 515 S Broad St SW
- 115 Lookout Cir SW
- 113 Lookout Cir SW
- 515 Harper Ave SW
- 107 Butler St SW
- 111 Lookout Cir SW
- 232 S Broad St SW
- 3 Grover St SW
- 110 Cherokee St SW
- 235 Pennington Ave SW
- 105 Mary St SW
- 334 Branham Ave SW
- 529 Branham Ave SW
- 515 Hardy Ave SW
- 410 Hardy Ave SW
- 3 Porter St SW
- 5 Jervis St SW
- 13 N Blanche Ave SW
- 17 McGhee St SW
- 13 McGhee St SW
- 19 McGhee St SW
- 0 McGhee St SW Unit 7086384
- 0 McGhee St SW Unit 8656713
- 0 McGhee St SW Unit 8466014
- 0 McGhee St SW Unit 7599955
- 0 McGhee St SW Unit 7600223
- 0 McGhee St SW
- 16 McGhee St SW
- 9 McGhee St SW
- 16 Butler St SW
- 14 Butler St SW
- 21 McGhee St SW
- 20 McGhee St SW
- 18 Butler St SW
- 8 McGhee St SW
- 10 Butler St SW
- 23 McGhee St SW
- 24 Butler St SW