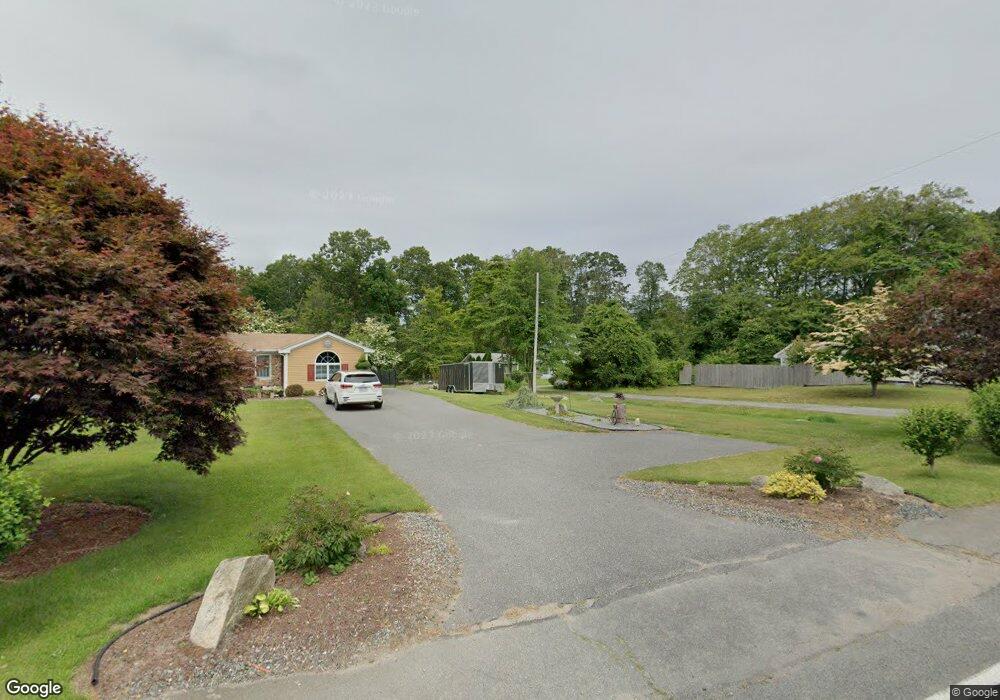
15 Michaud St Westport, MA 02790
North Westport NeighborhoodEstimated Value: $412,000 - $536,000
2
Beds
--
Bath
988
Sq Ft
$462/Sq Ft
Est. Value
About This Home
This home is located at 15 Michaud St, Westport, MA 02790 and is currently estimated at $456,199, approximately $461 per square foot. 15 Michaud St is a home located in Bristol County with nearby schools including Alice A. Macomber Primary School, Westport Elementary School, and Westport Middle-High School.
Ownership History
Date
Name
Owned For
Owner Type
Purchase Details
Closed on
Sep 26, 2014
Sold by
Fontaine Verna E
Bought by
Lheureux Debra
Current Estimated Value
Purchase Details
Closed on
Oct 26, 1995
Sold by
Corriveau Florian M and Corriveau Germaine
Bought by
Fontaine Roger R and Fontaine Verna E
Home Financials for this Owner
Home Financials are based on the most recent Mortgage that was taken out on this home.
Original Mortgage
$99,700
Interest Rate
7.6%
Mortgage Type
Purchase Money Mortgage
Create a Home Valuation Report for This Property
The Home Valuation Report is an in-depth analysis detailing your home's value as well as a comparison with similar homes in the area
Home Values in the Area
Average Home Value in this Area
Purchase History
| Date | Buyer | Sale Price | Title Company |
|---|---|---|---|
| Lheureux Debra | -- | -- | |
| Fontaine Roger R | $105,000 | -- |
Source: Public Records
Mortgage History
| Date | Status | Borrower | Loan Amount |
|---|---|---|---|
| Previous Owner | Fontaine Roger R | $85,600 | |
| Previous Owner | Fontaine Roger R | $96,500 | |
| Previous Owner | Fontaine Roger R | $99,700 | |
| Previous Owner | Fontaine Roger R | $23,000 |
Source: Public Records
Tax History Compared to Growth
Tax History
| Year | Tax Paid | Tax Assessment Tax Assessment Total Assessment is a certain percentage of the fair market value that is determined by local assessors to be the total taxable value of land and additions on the property. | Land | Improvement |
|---|---|---|---|---|
| 2025 | $2,755 | $369,800 | $162,900 | $206,900 |
| 2024 | $2,722 | $352,100 | $144,700 | $207,400 |
| 2023 | $2,564 | $314,200 | $131,800 | $182,400 |
| 2022 | $2,405 | $283,600 | $131,800 | $151,800 |
| 2021 | $2,247 | $260,700 | $108,900 | $151,800 |
| 2020 | $2,161 | $256,400 | $104,600 | $151,800 |
| 2019 | $2,086 | $252,200 | $104,600 | $147,600 |
| 2018 | $2,224 | $272,200 | $104,200 | $168,000 |
| 2017 | $2,105 | $264,100 | $100,900 | $163,200 |
| 2016 | $2,009 | $254,000 | $97,600 | $156,400 |
| 2015 | $1,829 | $230,600 | $99,800 | $130,800 |
Source: Public Records
Map
Nearby Homes