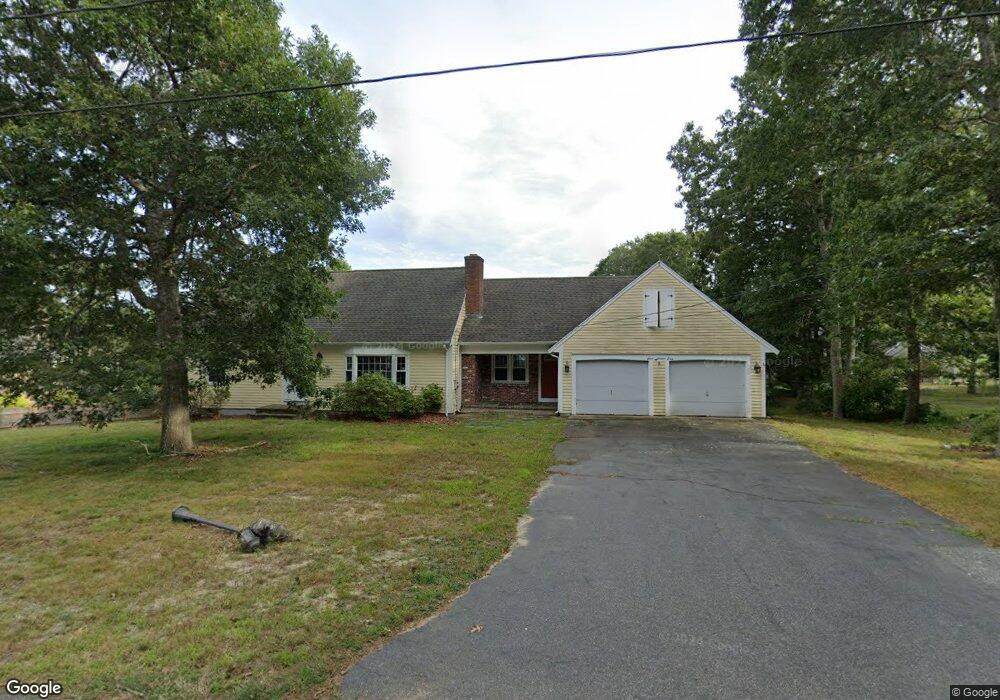
15 Midstream Dr South Yarmouth, MA 02664
South Yarmouth NeighborhoodEstimated Value: $682,837 - $710,000
2
Beds
2
Baths
1,201
Sq Ft
$584/Sq Ft
Est. Value
About This Home
This home is located at 15 Midstream Dr, South Yarmouth, MA 02664 and is currently estimated at $701,459, approximately $584 per square foot. 15 Midstream Dr is a home located in Barnstable County with nearby schools including Dennis-Yarmouth Regional High School and St. Pius X. School.
Ownership History
Date
Name
Owned For
Owner Type
Purchase Details
Closed on
May 28, 2002
Sold by
Graybill Daniel F and Staley Michelle Dee
Bought by
Lopilato Christopher G
Current Estimated Value
Purchase Details
Closed on
May 11, 1995
Sold by
Dunphy Herbert G and Dunphy Josephine S
Bought by
Graybill Daniel F and Graybill Elaine Cook
Home Financials for this Owner
Home Financials are based on the most recent Mortgage that was taken out on this home.
Original Mortgage
$100,000
Interest Rate
8.31%
Mortgage Type
Purchase Money Mortgage
Create a Home Valuation Report for This Property
The Home Valuation Report is an in-depth analysis detailing your home's value as well as a comparison with similar homes in the area
Home Values in the Area
Average Home Value in this Area
Purchase History
| Date | Buyer | Sale Price | Title Company |
|---|---|---|---|
| Lopilato Christopher G | $250,000 | -- | |
| Graybill Daniel F | $150,000 | -- |
Source: Public Records
Mortgage History
| Date | Status | Borrower | Loan Amount |
|---|---|---|---|
| Previous Owner | Graybill Daniel F | $100,000 |
Source: Public Records
Tax History Compared to Growth
Tax History
| Year | Tax Paid | Tax Assessment Tax Assessment Total Assessment is a certain percentage of the fair market value that is determined by local assessors to be the total taxable value of land and additions on the property. | Land | Improvement |
|---|---|---|---|---|
| 2025 | $4,822 | $681,100 | $235,200 | $445,900 |
| 2024 | $4,460 | $604,400 | $204,600 | $399,800 |
| 2023 | $4,355 | $537,000 | $172,600 | $364,400 |
| 2022 | $4,275 | $465,700 | $154,400 | $311,300 |
| 2021 | $4,200 | $439,300 | $154,400 | $284,900 |
| 2020 | $4,023 | $402,300 | $151,900 | $250,400 |
| 2019 | $3,755 | $371,800 | $151,900 | $219,900 |
| 2018 | $3,733 | $362,800 | $142,900 | $219,900 |
| 2017 | $3,635 | $362,800 | $142,900 | $219,900 |
| 2016 | $3,621 | $362,800 | $142,900 | $219,900 |
| 2015 | $3,376 | $336,300 | $142,900 | $193,400 |
Source: Public Records
Map
Nearby Homes
- 85 Keel Cape Dr
- 91 Chipping Green Cir
- 23 Fairwood Rd
- 21 Green Way
- 62 Old Fish House Rd
- 6 Hawthorn St
- 30 Pebble Beach Way
- 17 Fairmount Rd
- 401 Main St Unit 201
- 401 Main St Unit 101
- 17 Fairmount Rd
- 1 Country Club Dr
- 295 Main St
- 7 Vinland Dr
- 293 Main St
- 293 Main St
- 31 Duck Pond Rd
- 10 Joanne Dr
- 1 Norseman Dr
- 25 Skerry Rd
- 16 Keel Cape Dr
- 9 Midstream Dr
- 21 Midstream Dr
- 24 Keel Cape Dr
- 16 Midstream Dr
- 10 Keel Cape Dr
- 10 Midstream Dr
- 26 Midstream Dr
- 179 Blue Rock Rd
- 15 Keel Cape Dr
- 32 Keel Cape Dr
- 29 Midstream Dr
- 15 Runestone Rd
- 171 Blue Rock Rd
- 21 Keel Cape Dr
- 9 Runestone Rd
- 4 Keel Cape Dr
- 29 Keel Cape Dr
- 21 Runestone Rd
- 165 Blue Rock Rd