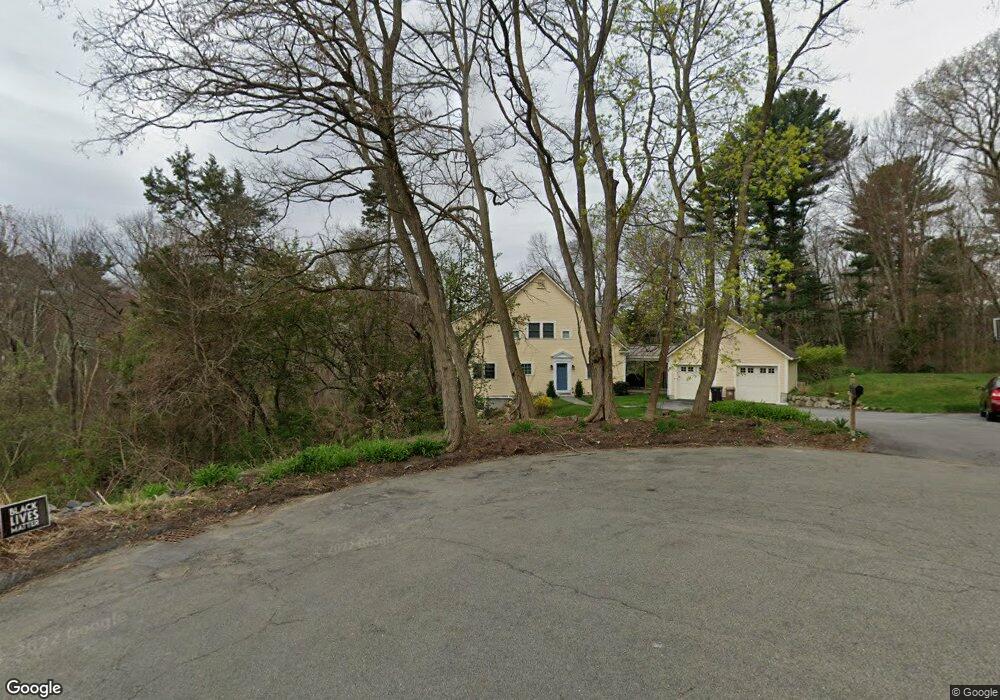
15 Morse Rd Wayland, MA 01778
Estimated Value: $1,375,117 - $1,597,000
3
Beds
3
Baths
2,464
Sq Ft
$588/Sq Ft
Est. Value
About This Home
This home is located at 15 Morse Rd, Wayland, MA 01778 and is currently estimated at $1,450,029, approximately $588 per square foot. 15 Morse Rd is a home located in Middlesex County with nearby schools including Wayland High School and Veritas Christian Academy.
Ownership History
Date
Name
Owned For
Owner Type
Purchase Details
Closed on
Nov 23, 2021
Sold by
Lloyd Christian and Lloyd Rebecca
Bought by
R & Christian Lloyd Ret
Current Estimated Value
Purchase Details
Closed on
Aug 4, 2014
Sold by
Sterling William A and Sterling Gretchen M
Bought by
Lloyd Christian and Lloyd Rebbeca
Home Financials for this Owner
Home Financials are based on the most recent Mortgage that was taken out on this home.
Original Mortgage
$499,200
Interest Rate
3%
Mortgage Type
New Conventional
Purchase Details
Closed on
Jun 5, 2013
Sold by
Sterling Gretchen M
Bought by
Sterling William A and Sterling Gretchen M
Create a Home Valuation Report for This Property
The Home Valuation Report is an in-depth analysis detailing your home's value as well as a comparison with similar homes in the area
Home Values in the Area
Average Home Value in this Area
Purchase History
| Date | Buyer | Sale Price | Title Company |
|---|---|---|---|
| R & Christian Lloyd Ret | -- | None Available | |
| Lloyd Christian | $624,000 | -- | |
| Sterling William A | -- | -- |
Source: Public Records
Mortgage History
| Date | Status | Borrower | Loan Amount |
|---|---|---|---|
| Previous Owner | Lloyd Christian | $499,200 |
Source: Public Records
Tax History Compared to Growth
Tax History
| Year | Tax Paid | Tax Assessment Tax Assessment Total Assessment is a certain percentage of the fair market value that is determined by local assessors to be the total taxable value of land and additions on the property. | Land | Improvement |
|---|---|---|---|---|
| 2025 | $19,906 | $1,273,600 | $569,500 | $704,100 |
| 2024 | $18,832 | $1,213,400 | $542,500 | $670,900 |
| 2023 | $17,666 | $1,061,000 | $493,100 | $567,900 |
| 2022 | $17,508 | $954,100 | $408,200 | $545,900 |
| 2021 | $16,983 | $917,000 | $371,100 | $545,900 |
| 2020 | $16,089 | $905,900 | $371,100 | $534,800 |
| 2019 | $15,909 | $870,300 | $353,600 | $516,700 |
| 2018 | $14,512 | $804,900 | $353,600 | $451,300 |
| 2017 | $13,774 | $759,300 | $336,700 | $422,600 |
| 2016 | $13,092 | $755,000 | $330,100 | $424,900 |
| 2015 | $13,441 | $730,900 | $330,100 | $400,800 |
Source: Public Records
Map
Nearby Homes
- 156 Boston Post Rd
- 11 Wadsworth Ln Unit 11
- 10 Hayward Rd
- 2 Forest Hill Rd
- 14 Lundy Ln
- 31 White Rd
- 19 Old Connecticut Path
- 7 Shaw Dr
- 17 Hastings Way Unit 17
- 23 Covered Bridge Ln
- 24 Claypit Hill Rd
- 82 Buckskin Dr
- 1605 Wisteria Way
- 1601 Wisteria Way
- 1004 Wisteria Way
- 42 Westerly Rd
- 72 Love Ln
- 12 Astra
- 50 3 Ponds Rd
- 17 Glezen Ln