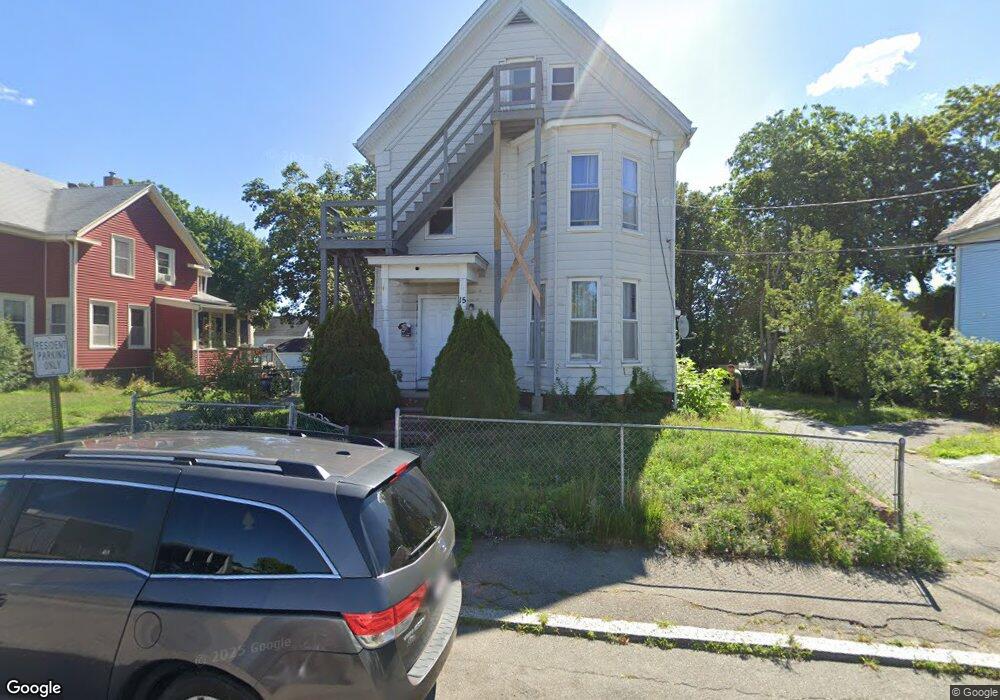
15 Mulberry St Brockton, MA 02302
Estimated Value: $598,000 - $791,000
6
Beds
3
Baths
1,824
Sq Ft
$386/Sq Ft
Est. Value
About This Home
This home is located at 15 Mulberry St, Brockton, MA 02302 and is currently estimated at $704,000, approximately $385 per square foot. 15 Mulberry St is a home located in Plymouth County with nearby schools including Brookfield Elementary School, Downey Elementary School, and Ashfield Middle School.
Ownership History
Date
Name
Owned For
Owner Type
Purchase Details
Closed on
Nov 7, 2001
Sold by
Royster Ira G
Bought by
Lara Luis
Current Estimated Value
Home Financials for this Owner
Home Financials are based on the most recent Mortgage that was taken out on this home.
Original Mortgage
$223,849
Interest Rate
6.77%
Mortgage Type
Purchase Money Mortgage
Purchase Details
Closed on
Nov 9, 1995
Sold by
Deutsch Paula J
Bought by
Royster Ira G
Purchase Details
Closed on
Aug 25, 1993
Sold by
Home Svgs Of America
Bought by
Deutsch Russell A
Purchase Details
Closed on
Apr 17, 1992
Sold by
Alves John Y
Bought by
Home Sb Of America
Purchase Details
Closed on
Dec 29, 1987
Sold by
Teixeira Alberto
Bought by
Alves John T
Create a Home Valuation Report for This Property
The Home Valuation Report is an in-depth analysis detailing your home's value as well as a comparison with similar homes in the area
Home Values in the Area
Average Home Value in this Area
Purchase History
| Date | Buyer | Sale Price | Title Company |
|---|---|---|---|
| Lara Luis | $194,000 | -- | |
| Royster Ira G | $65,000 | -- | |
| Deutsch Russell A | $27,500 | -- | |
| Home Sb Of America | $108,000 | -- | |
| Alves John T | $160,000 | -- |
Source: Public Records
Mortgage History
| Date | Status | Borrower | Loan Amount |
|---|---|---|---|
| Open | Alves John T | $160,000 | |
| Closed | Alves John T | $13,613 | |
| Closed | Alves John T | $223,849 |
Source: Public Records
Tax History Compared to Growth
Tax History
| Year | Tax Paid | Tax Assessment Tax Assessment Total Assessment is a certain percentage of the fair market value that is determined by local assessors to be the total taxable value of land and additions on the property. | Land | Improvement |
|---|---|---|---|---|
| 2025 | $7,020 | $579,700 | $140,300 | $439,400 |
| 2024 | $6,773 | $563,500 | $140,300 | $423,200 |
| 2023 | $6,477 | $499,000 | $105,600 | $393,400 |
| 2022 | $6,256 | $447,800 | $96,000 | $351,800 |
| 2021 | $5,545 | $382,400 | $80,100 | $302,300 |
| 2020 | $4,686 | $309,300 | $74,700 | $234,600 |
| 2019 | $4,951 | $318,600 | $72,800 | $245,800 |
| 2018 | $4,079 | $254,000 | $72,800 | $181,200 |
| 2017 | $4,304 | $267,300 | $72,800 | $194,500 |
| 2016 | $3,387 | $195,100 | $70,600 | $124,500 |
| 2015 | $2,935 | $161,700 | $70,600 | $91,100 |
| 2014 | $2,763 | $152,400 | $70,600 | $81,800 |
Source: Public Records
Map
Nearby Homes
- 9 Mulberry St
- 23 Mulberry St
- 86 Elliot St
- 78 Elliot St
- 14 Emmet St
- 27 Mulberry St
- 18 Emmet St
- 92 Elliot St
- 92 Elliot St Unit 92 Elliot st Unit 3
- 92 Elliot St Unit 3
- 92 Elliot St Unit 1
- 68 Elliot St
- 16 Emmet St
- 22 Emmet St
- 24 Emmet St Unit 1
- 24 Emmet St
- 12 Emmet St
- 33 Mulberry St
- 79 Elliot St
- 96 Elliot St