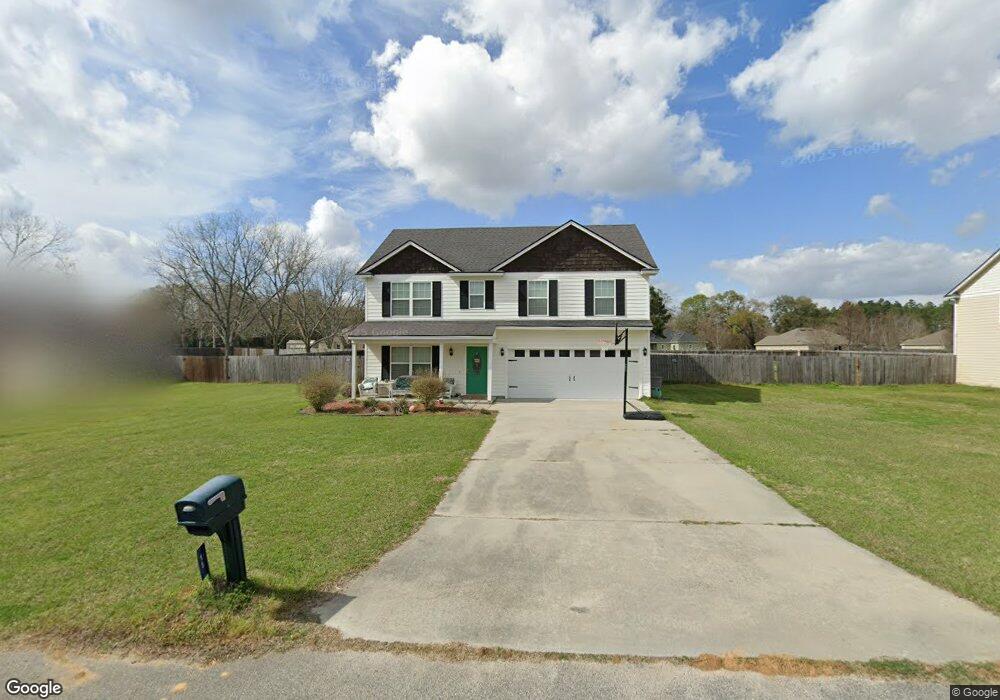
15 N Moody Dr Ray City, GA 31645
Estimated Value: $275,000 - $306,000
4
Beds
3
Baths
2,096
Sq Ft
$136/Sq Ft
Est. Value
About This Home
This home is located at 15 N Moody Dr, Ray City, GA 31645 and is currently estimated at $285,477, approximately $136 per square foot. 15 N Moody Dr is a home located in Lanier County with nearby schools including Lanier County Elementary School, Lanier County Middle School, and Lanier County High School.
Ownership History
Date
Name
Owned For
Owner Type
Purchase Details
Closed on
May 18, 2018
Sold by
Griswold Savannah A
Bought by
Lopez Recinos Isaias A and Lopez Ciara Leanna
Current Estimated Value
Home Financials for this Owner
Home Financials are based on the most recent Mortgage that was taken out on this home.
Original Mortgage
$145,146
Outstanding Balance
$124,976
Interest Rate
4.4%
Mortgage Type
FHA
Estimated Equity
$160,501
Purchase Details
Closed on
Apr 25, 2017
Sold by
Jones Keith E
Bought by
Griswold Tyler E and Griswold Savannah Marie
Home Financials for this Owner
Home Financials are based on the most recent Mortgage that was taken out on this home.
Original Mortgage
$161,397
Interest Rate
4.14%
Mortgage Type
VA
Purchase Details
Closed on
Mar 22, 2010
Sold by
The Citizens Bank
Bought by
Harris John A
Home Financials for this Owner
Home Financials are based on the most recent Mortgage that was taken out on this home.
Original Mortgage
$163,429
Interest Rate
4.91%
Mortgage Type
VA
Create a Home Valuation Report for This Property
The Home Valuation Report is an in-depth analysis detailing your home's value as well as a comparison with similar homes in the area
Home Values in the Area
Average Home Value in this Area
Purchase History
| Date | Buyer | Sale Price | Title Company |
|---|---|---|---|
| Lopez Recinos Isaias A | $158,500 | -- | |
| Griswold Tyler E | $158,000 | -- | |
| Harris John A | -- | -- |
Source: Public Records
Mortgage History
| Date | Status | Borrower | Loan Amount |
|---|---|---|---|
| Open | Lopez Recinos Isaias A | $145,146 | |
| Previous Owner | Griswold Tyler E | $161,397 | |
| Previous Owner | Harris John A | $163,429 |
Source: Public Records
Tax History Compared to Growth
Tax History
| Year | Tax Paid | Tax Assessment Tax Assessment Total Assessment is a certain percentage of the fair market value that is determined by local assessors to be the total taxable value of land and additions on the property. | Land | Improvement |
|---|---|---|---|---|
| 2024 | $2,731 | $100,760 | $6,000 | $94,760 |
| 2023 | $2,475 | $77,960 | $6,000 | $71,960 |
| 2022 | $2,475 | $77,960 | $6,000 | $71,960 |
| 2021 | $1,879 | $57,960 | $6,000 | $51,960 |
| 2020 | $1,894 | $57,960 | $6,000 | $51,960 |
| 2019 | $1,894 | $57,960 | $6,000 | $51,960 |
| 2018 | $1,894 | $57,960 | $6,000 | $51,960 |
| 2017 | $1,895 | $57,960 | $6,000 | $51,960 |
| 2016 | $1,931 | $58,840 | $6,000 | $52,840 |
| 2015 | -- | $58,840 | $6,000 | $52,840 |
| 2014 | -- | $58,840 | $6,000 | $52,840 |
| 2013 | -- | $58,840 | $6,000 | $52,840 |
Source: Public Records
Map
Nearby Homes
- 15 Amber Dr
- 63 Knowles Rd
- 7322 Georgia 122 Unit 13
- 391 Georgia 125
- 11 Gatling Way
- 15 Gatling Way
- 26 Prescott Dr
- 24 Prescott Dr
- 501 Georgia 125
- 11 Bryant Dr
- 28 Barrett Ln
- 44 Lancer Ln
- 508 Beaver Street Extention
- 15 Water Lily Way
- 61 Cypress St
- 0 Johnson Street Extension
- 16 Bluegill Ln
- 19 Red Oak St
- 7 Red Oak St
- 79 Lakeview Dr
- 11 N Moody Dr Unit 49
- 19 N Moody Dr
- 21 N Moody Dr
- 51 W Stanley Rd Extension
- 47 W Stanley Rd
- 314 Smith Dairy Rd
- 12 N Moody Dr
- 14 N Moody Dr
- 18 Moody Dr
- 53 Stanley Rd Ext Rd
- 43 W Stanley Rd Extension
- 10 N Moody Dr
- 25 N Moody Dr
- 18 N Moody Dr
- 55 W Stanley Rd
- 322 Smith Dairy Rd
- 304 Smith Dairy Rd
- 20 N Moody Dr
- 20 N Moody
- 39 W Stanley Rd