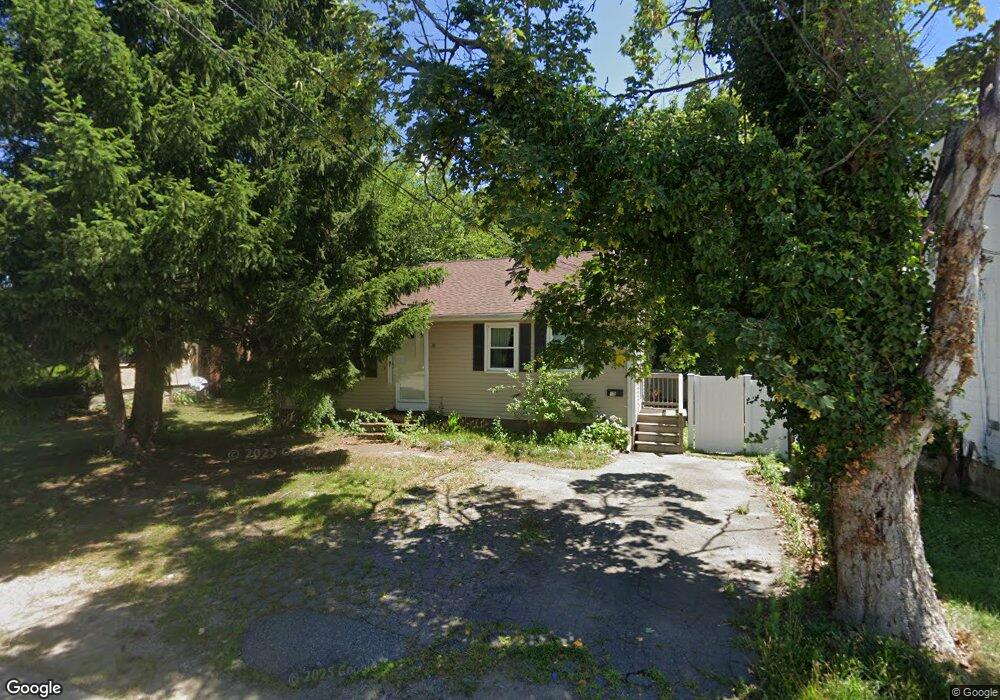
15 Neal St Brockton, MA 02301
Estimated Value: $476,000 - $503,000
3
Beds
1
Bath
1,496
Sq Ft
$327/Sq Ft
Est. Value
About This Home
This home is located at 15 Neal St, Brockton, MA 02301 and is currently estimated at $488,472, approximately $326 per square foot. 15 Neal St is a home located in Plymouth County with nearby schools including Louis F Angelo Elementary School, Manthala George Jr. School, and Raymond K-8 Elementary School.
Ownership History
Date
Name
Owned For
Owner Type
Purchase Details
Closed on
Jul 31, 1991
Sold by
Foley Richard W and Foley Joanne
Bought by
Francisque Jos F and Francisque Marie
Current Estimated Value
Home Financials for this Owner
Home Financials are based on the most recent Mortgage that was taken out on this home.
Original Mortgage
$91,551
Interest Rate
9.58%
Mortgage Type
Purchase Money Mortgage
Create a Home Valuation Report for This Property
The Home Valuation Report is an in-depth analysis detailing your home's value as well as a comparison with similar homes in the area
Home Values in the Area
Average Home Value in this Area
Purchase History
| Date | Buyer | Sale Price | Title Company |
|---|---|---|---|
| Francisque Jos F | $97,900 | -- |
Source: Public Records
Mortgage History
| Date | Status | Borrower | Loan Amount |
|---|---|---|---|
| Open | Francisque Jos F | $176,500 | |
| Closed | Francisque Jos F | $126,000 | |
| Closed | Francisque Jos F | $91,551 |
Source: Public Records
Tax History Compared to Growth
Tax History
| Year | Tax Paid | Tax Assessment Tax Assessment Total Assessment is a certain percentage of the fair market value that is determined by local assessors to be the total taxable value of land and additions on the property. | Land | Improvement |
|---|---|---|---|---|
| 2025 | $4,672 | $385,800 | $137,700 | $248,100 |
| 2024 | $4,432 | $368,700 | $137,700 | $231,000 |
| 2023 | $4,591 | $353,700 | $102,700 | $251,000 |
| 2022 | $3,928 | $281,200 | $93,300 | $187,900 |
| 2021 | $3,899 | $268,900 | $77,200 | $191,700 |
| 2020 | $3,722 | $245,700 | $72,600 | $173,100 |
| 2019 | $3,512 | $226,000 | $70,500 | $155,500 |
| 2018 | $3,154 | $196,400 | $70,500 | $125,900 |
| 2017 | $2,734 | $169,800 | $70,500 | $99,300 |
| 2016 | $3,323 | $191,400 | $68,300 | $123,100 |
| 2015 | $2,980 | $164,200 | $68,300 | $95,900 |
| 2014 | $3,001 | $165,500 | $68,300 | $97,200 |
Source: Public Records
Map
Nearby Homes
- 11 Neal St
- 11 Neal St Unit 2
- 19 Neal St
- 45 Battles St
- 45 Battles St Unit 1
- 45 Battles St Unit 2
- 49 Battles St
- 49 Battles St Unit 2
- 3 Neal St
- 27 Neal St
- 65 Battles St
- 65 Battles St Unit 2-East
- 24 Bunker Ave
- 43 Battles St
- 20 Bunker Ave
- 28 Bunker Ave
- 22 Neal St
- 37 Battles St
- 47 Battles St
- 73 Battles St