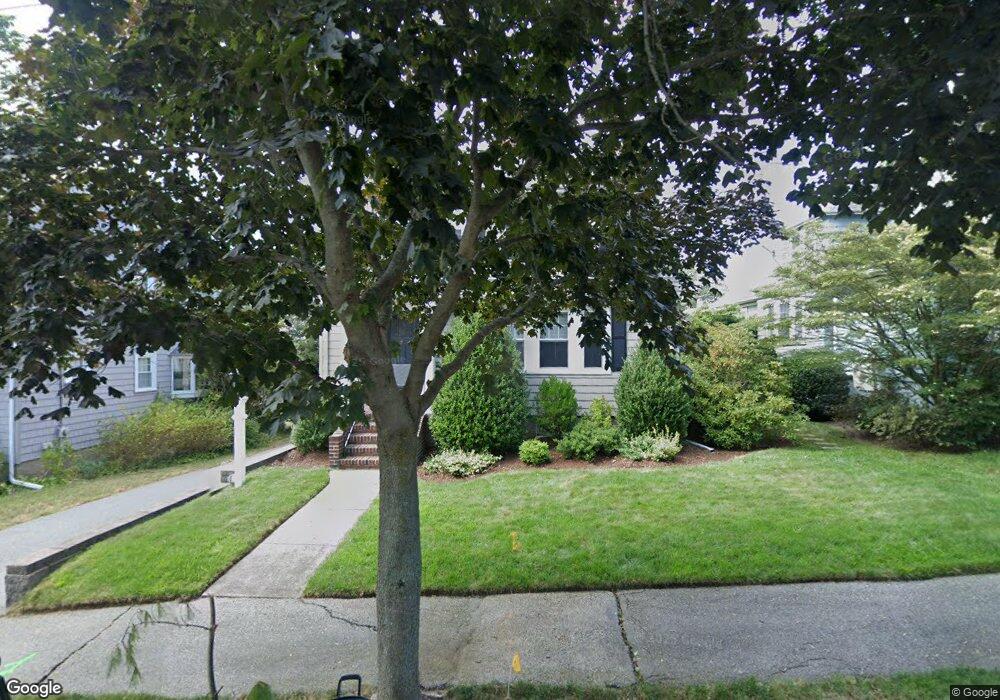
15 Nicholl St Quincy, MA 02169
South Quincy NeighborhoodEstimated Value: $844,811 - $944,000
4
Beds
4
Baths
2,009
Sq Ft
$444/Sq Ft
Est. Value
About This Home
This home is located at 15 Nicholl St, Quincy, MA 02169 and is currently estimated at $892,203, approximately $444 per square foot. 15 Nicholl St is a home located in Norfolk County with nearby schools including Lincoln-Hancock Community School, South West Middle School, and Quincy High School.
Ownership History
Date
Name
Owned For
Owner Type
Purchase Details
Closed on
Oct 15, 1996
Sold by
Cox Alice M
Bought by
Hobin Thomas J and Hobin Carol L
Current Estimated Value
Purchase Details
Closed on
Jan 19, 1989
Sold by
Gilmore Herbert E
Bought by
Cox Alice M
Create a Home Valuation Report for This Property
The Home Valuation Report is an in-depth analysis detailing your home's value as well as a comparison with similar homes in the area
Home Values in the Area
Average Home Value in this Area
Purchase History
| Date | Buyer | Sale Price | Title Company |
|---|---|---|---|
| Hobin Thomas J | $170,000 | -- | |
| Cox Alice M | $180,000 | -- |
Source: Public Records
Mortgage History
| Date | Status | Borrower | Loan Amount |
|---|---|---|---|
| Open | Cox Alice M | $416,000 | |
| Closed | Cox Alice M | $32,600 |
Source: Public Records
Tax History Compared to Growth
Tax History
| Year | Tax Paid | Tax Assessment Tax Assessment Total Assessment is a certain percentage of the fair market value that is determined by local assessors to be the total taxable value of land and additions on the property. | Land | Improvement |
|---|---|---|---|---|
| 2025 | $8,419 | $730,200 | $284,500 | $445,700 |
| 2024 | $8,034 | $712,900 | $271,000 | $441,900 |
| 2023 | $7,345 | $659,900 | $246,400 | $413,500 |
| 2022 | $7,420 | $619,400 | $205,300 | $414,100 |
| 2021 | $7,112 | $585,800 | $205,300 | $380,500 |
| 2020 | $7,354 | $591,600 | $205,300 | $386,300 |
| 2019 | $6,717 | $535,200 | $193,700 | $341,500 |
| 2018 | $6,771 | $507,600 | $179,300 | $328,300 |
| 2017 | $6,382 | $450,400 | $170,800 | $279,600 |
| 2016 | $5,846 | $407,100 | $148,500 | $258,600 |
| 2015 | $5,795 | $396,900 | $148,500 | $248,400 |
| 2014 | $5,079 | $341,800 | $148,500 | $193,300 |
Source: Public Records
Map
Nearby Homes
- 155 Kendrick Ave Unit T7
- 83 Madison Ave
- 10 Hughes St
- 102 Conrad St
- 166 Phipps St
- 106 Home Park Rd
- 25 John Paul Cir
- 72 Federal Ave
- 11 Rogers Cir
- 218 Independence Ave Unit B
- 195 Independence Ave Unit 137
- 161 Cedar St
- 54 Elmlawn Rd
- 9 Independence Ave Unit 212
- 5 Pearl St
- 23 Bower Rd
- 57 Summer St
- 8 Jackson St Unit B2
- 200 Falls Blvd Unit G110
- 200 Falls Blvd Unit F206