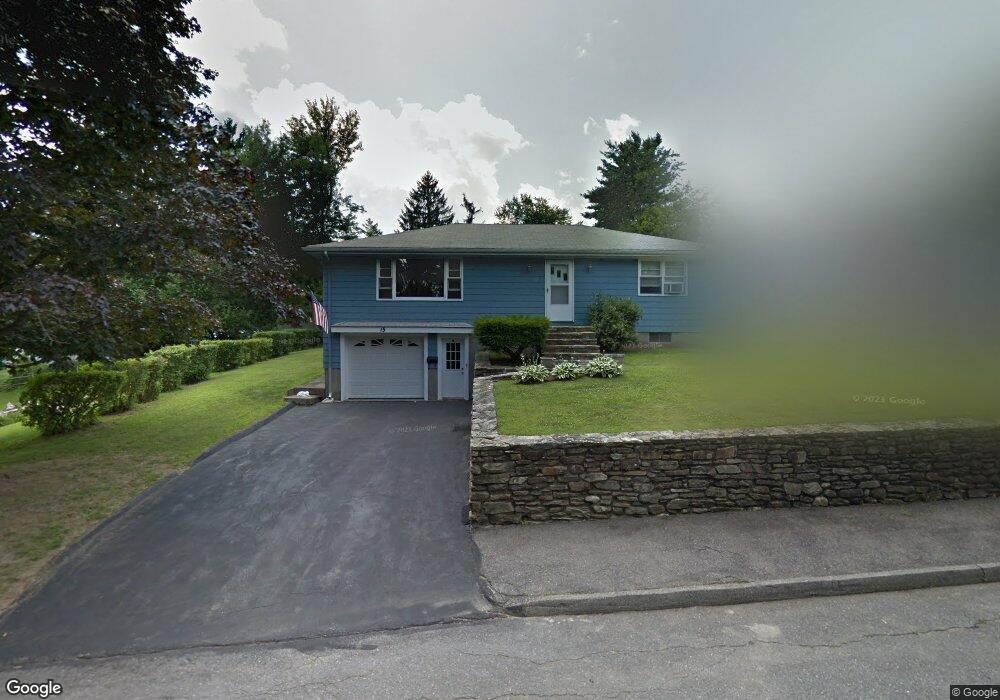
15 Nome St Worcester, MA 01605
Estimated Value: $486,000 - $571,000
4
Beds
3
Baths
1,440
Sq Ft
$358/Sq Ft
Est. Value
About This Home
This home is located at 15 Nome St, Worcester, MA 01605 and is currently estimated at $514,930, approximately $357 per square foot. 15 Nome St is a home located in Worcester County with nearby schools including Jacob Hiatt Magnet School, Chandler Magnet, and Lincoln Street School.
Ownership History
Date
Name
Owned For
Owner Type
Purchase Details
Closed on
Jun 15, 2012
Sold by
Nguyen Jennifer
Bought by
Campos Karen M
Current Estimated Value
Home Financials for this Owner
Home Financials are based on the most recent Mortgage that was taken out on this home.
Original Mortgage
$203,666
Outstanding Balance
$143,053
Interest Rate
4.12%
Mortgage Type
FHA
Estimated Equity
$371,877
Create a Home Valuation Report for This Property
The Home Valuation Report is an in-depth analysis detailing your home's value as well as a comparison with similar homes in the area
Home Values in the Area
Average Home Value in this Area
Purchase History
| Date | Buyer | Sale Price | Title Company |
|---|---|---|---|
| Campos Karen M | $188,150 | -- |
Source: Public Records
Mortgage History
| Date | Status | Borrower | Loan Amount |
|---|---|---|---|
| Open | Campos Karen M | $203,666 |
Source: Public Records
Tax History Compared to Growth
Tax History
| Year | Tax Paid | Tax Assessment Tax Assessment Total Assessment is a certain percentage of the fair market value that is determined by local assessors to be the total taxable value of land and additions on the property. | Land | Improvement |
|---|---|---|---|---|
| 2025 | $5,011 | $379,900 | $76,700 | $303,200 |
| 2024 | $4,865 | $353,800 | $76,700 | $277,100 |
| 2023 | $4,731 | $329,900 | $61,600 | $268,300 |
| 2022 | $4,400 | $289,300 | $49,300 | $240,000 |
| 2021 | $4,371 | $268,500 | $39,400 | $229,100 |
| 2020 | $4,219 | $248,200 | $39,500 | $208,700 |
| 2019 | $4,046 | $224,800 | $39,000 | $185,800 |
| 2018 | $4,037 | $213,500 | $39,000 | $174,500 |
| 2017 | $3,832 | $199,400 | $39,000 | $160,400 |
| 2016 | $3,947 | $191,500 | $31,100 | $160,400 |
| 2015 | $3,843 | $191,500 | $31,100 | $160,400 |
| 2014 | $3,742 | $191,500 | $31,100 | $160,400 |
Source: Public Records
Map
Nearby Homes
- 25 White Ave
- 22 Huron Ave
- 3 Huron Ave
- 57 Pasadena Pkwy
- 15 Wayside Rd
- 2206 Halcyon Dr Unit 2206
- 304 Saint Nicholas Ave
- 8 Cherry Blossom Cir Unit 50
- 276 Saint Nicholas Ave
- 23 Viele Ave
- 45 Goldthwaite Rd
- 120 Bay State Rd
- 113 Bay State Rd
- 13 Fatima Ln
- 9 Green Hill Ave
- 95 Saint Nicholas Ave
- 31 Enaya Cir Unit 31
- 5A Wigwam Hill Dr Unit A
- 2 Maria Ln Unit 2
- 14 Mary Ann Dr