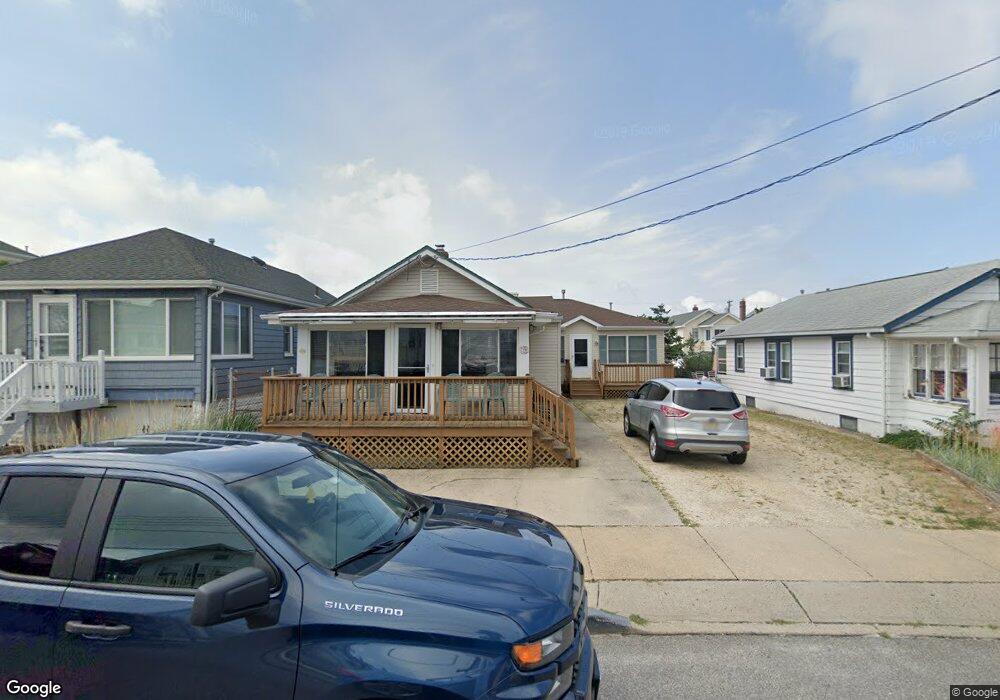
15 O St Seaside Park, NJ 08752
Estimated Value: $900,000 - $1,164,695
8
Beds
3
Baths
1,612
Sq Ft
$656/Sq Ft
Est. Value
About This Home
This home is located at 15 O St, Seaside Park, NJ 08752 and is currently estimated at $1,057,674, approximately $656 per square foot. 15 O St is a home located in Ocean County with nearby schools including Central Regional Middle School and Central Regional High School.
Ownership History
Date
Name
Owned For
Owner Type
Purchase Details
Closed on
Oct 23, 2006
Sold by
Alern John F
Bought by
Alern Patricia A and Alern John F
Current Estimated Value
Purchase Details
Closed on
May 26, 2005
Sold by
Ahern John
Bought by
Ahern John and Ahern Patricia A
Home Financials for this Owner
Home Financials are based on the most recent Mortgage that was taken out on this home.
Original Mortgage
$175,000
Interest Rate
6.21%
Mortgage Type
New Conventional
Create a Home Valuation Report for This Property
The Home Valuation Report is an in-depth analysis detailing your home's value as well as a comparison with similar homes in the area
Home Values in the Area
Average Home Value in this Area
Purchase History
| Date | Buyer | Sale Price | Title Company |
|---|---|---|---|
| Alern Patricia A | -- | None Available | |
| Ahern John | -- | First American Title Ins Co |
Source: Public Records
Mortgage History
| Date | Status | Borrower | Loan Amount |
|---|---|---|---|
| Closed | Ahern John | $175,000 |
Source: Public Records
Tax History Compared to Growth
Tax History
| Year | Tax Paid | Tax Assessment Tax Assessment Total Assessment is a certain percentage of the fair market value that is determined by local assessors to be the total taxable value of land and additions on the property. | Land | Improvement |
|---|---|---|---|---|
| 2025 | $9,340 | $570,900 | $450,000 | $120,900 |
| 2024 | $9,186 | $570,900 | $450,000 | $120,900 |
| 2023 | $8,860 | $570,900 | $450,000 | $120,900 |
| 2022 | $8,860 | $570,900 | $450,000 | $120,900 |
| 2021 | $8,672 | $570,900 | $450,000 | $120,900 |
| 2020 | $8,581 | $570,900 | $450,000 | $120,900 |
| 2019 | $8,489 | $570,900 | $450,000 | $120,900 |
| 2018 | $7,936 | $570,900 | $450,000 | $120,900 |
| 2017 | $8,055 | $570,900 | $450,000 | $120,900 |
| 2016 | $7,490 | $570,900 | $450,000 | $120,900 |
| 2015 | $7,816 | $570,900 | $450,000 | $120,900 |
| 2014 | $7,467 | $570,900 | $450,000 | $120,900 |
Source: Public Records
Map
Nearby Homes