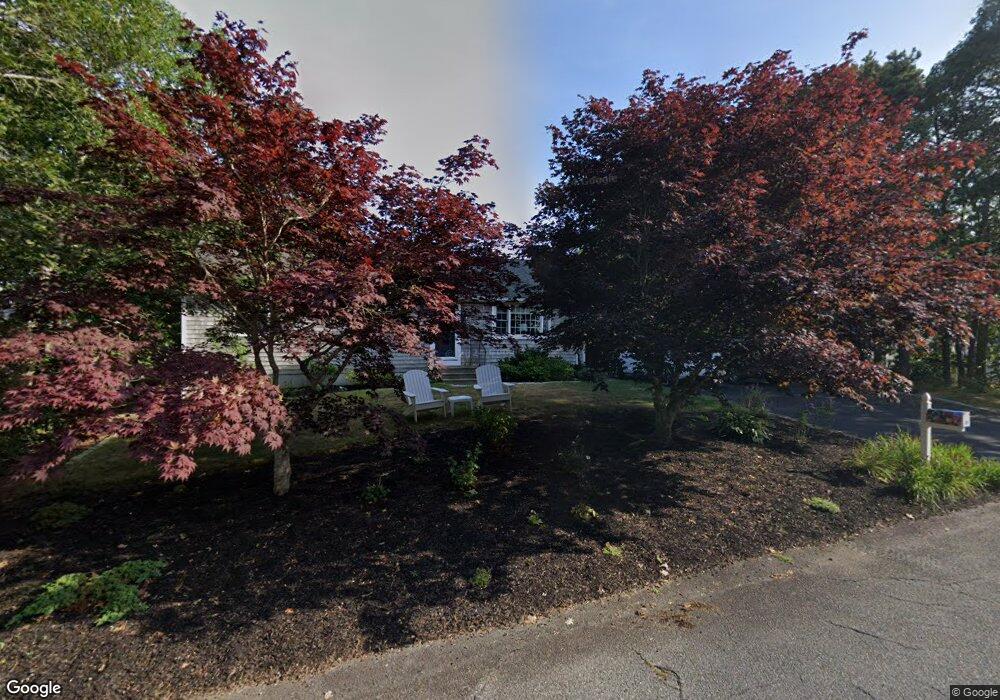
15 Oak Ridge Cir Chatham, MA 02633
West Chatham NeighborhoodEstimated Value: $948,863 - $1,012,000
3
Beds
2
Baths
1,192
Sq Ft
$819/Sq Ft
Est. Value
About This Home
This home is located at 15 Oak Ridge Cir, Chatham, MA 02633 and is currently estimated at $976,716, approximately $819 per square foot. 15 Oak Ridge Cir is a home located in Barnstable County with nearby schools including Chatham Elementary School, Harwich Elementary School, and Monomoy Regional Middle School.
Ownership History
Date
Name
Owned For
Owner Type
Purchase Details
Closed on
Sep 26, 2018
Sold by
Devine Mary A and Devine David A
Bought by
15 Oakridge Circle Rt
Current Estimated Value
Purchase Details
Closed on
Dec 20, 2017
Sold by
Earley Charles S and Monahan-Earley Rita A
Bought by
Devine Mary A and Devine David A
Home Financials for this Owner
Home Financials are based on the most recent Mortgage that was taken out on this home.
Original Mortgage
$200,000
Interest Rate
3.9%
Mortgage Type
New Conventional
Purchase Details
Closed on
Sep 30, 1992
Sold by
Fox Allan J and Fox Jennifer C
Bought by
Earley Charles S and Earley Monihan-Earley R
Create a Home Valuation Report for This Property
The Home Valuation Report is an in-depth analysis detailing your home's value as well as a comparison with similar homes in the area
Home Values in the Area
Average Home Value in this Area
Purchase History
| Date | Buyer | Sale Price | Title Company |
|---|---|---|---|
| 15 Oakridge Circle Rt | -- | -- | |
| Devine Mary A | $480,000 | -- | |
| Earley Charles S | $156,000 | -- |
Source: Public Records
Mortgage History
| Date | Status | Borrower | Loan Amount |
|---|---|---|---|
| Previous Owner | Devine Mary A | $200,000 |
Source: Public Records
Tax History Compared to Growth
Tax History
| Year | Tax Paid | Tax Assessment Tax Assessment Total Assessment is a certain percentage of the fair market value that is determined by local assessors to be the total taxable value of land and additions on the property. | Land | Improvement |
|---|---|---|---|---|
| 2025 | $2,895 | $834,200 | $382,100 | $452,100 |
| 2024 | $2,826 | $791,700 | $360,400 | $431,300 |
| 2023 | $2,688 | $692,800 | $300,300 | $392,500 |
| 2022 | $2,644 | $572,300 | $300,300 | $272,000 |
| 2021 | $2,589 | $519,800 | $273,000 | $246,800 |
| 2020 | $2,457 | $509,700 | $273,000 | $236,700 |
| 2019 | $2,093 | $431,600 | $255,200 | $176,400 |
| 2018 | $1,889 | $387,900 | $235,600 | $152,300 |
| 2017 | $1,902 | $378,200 | $228,700 | $149,500 |
| 2016 | $1,861 | $370,800 | $224,200 | $146,600 |
| 2015 | $1,843 | $369,300 | $226,900 | $142,400 |
| 2014 | $1,875 | $369,100 | $226,900 | $142,200 |
Source: Public Records
Map
Nearby Homes
- 116 Happy Valley Rd
- 38 Indian Trail
- 6 Stephen Dr
- 291 Ridgevale Rd
- 30 Indian Trail
- 40 Youngs Farm Ln
- 114 Bucks Creek Rd
- 1761 Main St
- 93 Bucks Creek Rd
- 0 George Ryder Rd Unit 22301591
- 0 George Ryder Rd Unit 73104629
- 44 Buena Vista Rd
- 200 Hardings Beach Rd
- 0 Evergreen Ln
- 70 Lantern Ln
- 94 Ocean Port Ln
- 17 Bucks Ln
- 314 Cockle Cove Rd
- 34 Overlook Dr
- 25 Oak Ridge Cir
- 18 Oak Ridge Cir
- 48 Overlook Dr
- 24 Tern Ln
- 28 Oak Ridge Cir
- 58 Overlook Dr
- 31 Overlook Dr
- 27 Tern Ln
- 41 Tern Ln
- 45 Overlook Dr
- 35 Oak Ridge Cir
- 66 Overlook Dr
- 19 Tern Ln
- 6 Tern Ln
- 3 Sulphur Springs Rd
- 38 Oak Ridge Cir
- 19 Overlook Dr
- 8 Overlook Dr
- 67 Sulphur Springs Rd