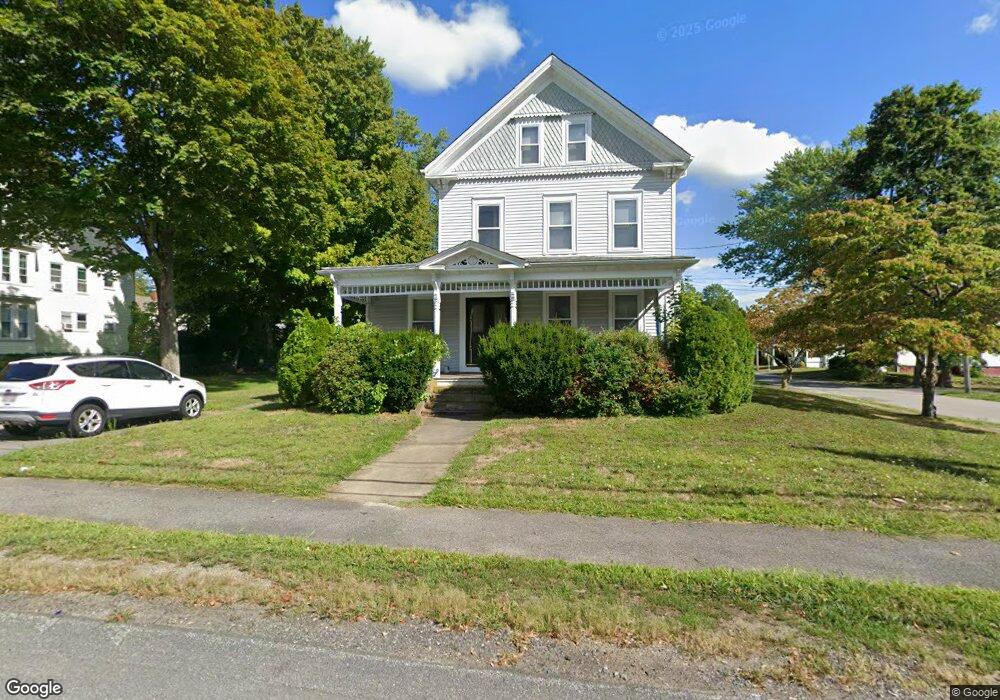
15 Oak St Middleboro, MA 02346
Estimated Value: $528,000 - $854,000
5
Beds
3
Baths
2,482
Sq Ft
$256/Sq Ft
Est. Value
About This Home
This home is located at 15 Oak St, Middleboro, MA 02346 and is currently estimated at $634,587, approximately $255 per square foot. 15 Oak St is a home located in Plymouth County with nearby schools including Mary K. Goode Elementary School and Mullein Hill Christian Academy.
Ownership History
Date
Name
Owned For
Owner Type
Purchase Details
Closed on
May 17, 1996
Sold by
Martenson Anders
Bought by
Lewis John W and Lewis Gina M
Current Estimated Value
Purchase Details
Closed on
Nov 24, 1992
Sold by
Wing Priscilla V M
Bought by
Martenson Anders
Purchase Details
Closed on
Nov 19, 1992
Sold by
Sterling Gladys J
Bought by
Martenson Anders
Purchase Details
Closed on
Oct 2, 1992
Sold by
Jr Charles E-Laman
Bought by
Martenson Anders
Create a Home Valuation Report for This Property
The Home Valuation Report is an in-depth analysis detailing your home's value as well as a comparison with similar homes in the area
Home Values in the Area
Average Home Value in this Area
Purchase History
| Date | Buyer | Sale Price | Title Company |
|---|---|---|---|
| Lewis John W | $110,000 | -- | |
| Martenson Anders | $7,705 | -- | |
| Martenson Anders | $7,705 | -- | |
| Martenson Anders | $7,705 | -- |
Source: Public Records
Mortgage History
| Date | Status | Borrower | Loan Amount |
|---|---|---|---|
| Open | Martenson Anders | $221,000 | |
| Closed | Martenson Anders | $150,000 | |
| Closed | Martenson Anders | $165,600 |
Source: Public Records
Tax History Compared to Growth
Tax History
| Year | Tax Paid | Tax Assessment Tax Assessment Total Assessment is a certain percentage of the fair market value that is determined by local assessors to be the total taxable value of land and additions on the property. | Land | Improvement |
|---|---|---|---|---|
| 2025 | $6,985 | $520,900 | $167,000 | $353,900 |
| 2024 | $6,771 | $500,100 | $159,100 | $341,000 |
| 2023 | $7,121 | $500,100 | $159,100 | $341,000 |
| 2022 | $6,333 | $411,800 | $138,300 | $273,500 |
| 2021 | $5,841 | $359,000 | $121,400 | $237,600 |
| 2020 | $5,379 | $338,700 | $121,400 | $217,300 |
| 2019 | $5,076 | $327,900 | $121,400 | $206,500 |
| 2018 | $4,410 | $282,700 | $115,600 | $167,100 |
| 2017 | $4,247 | $269,300 | $111,200 | $158,100 |
| 2016 | $4,010 | $251,900 | $101,700 | $150,200 |
| 2015 | $3,852 | $244,100 | $101,700 | $142,400 |
Source: Public Records
Map
Nearby Homes