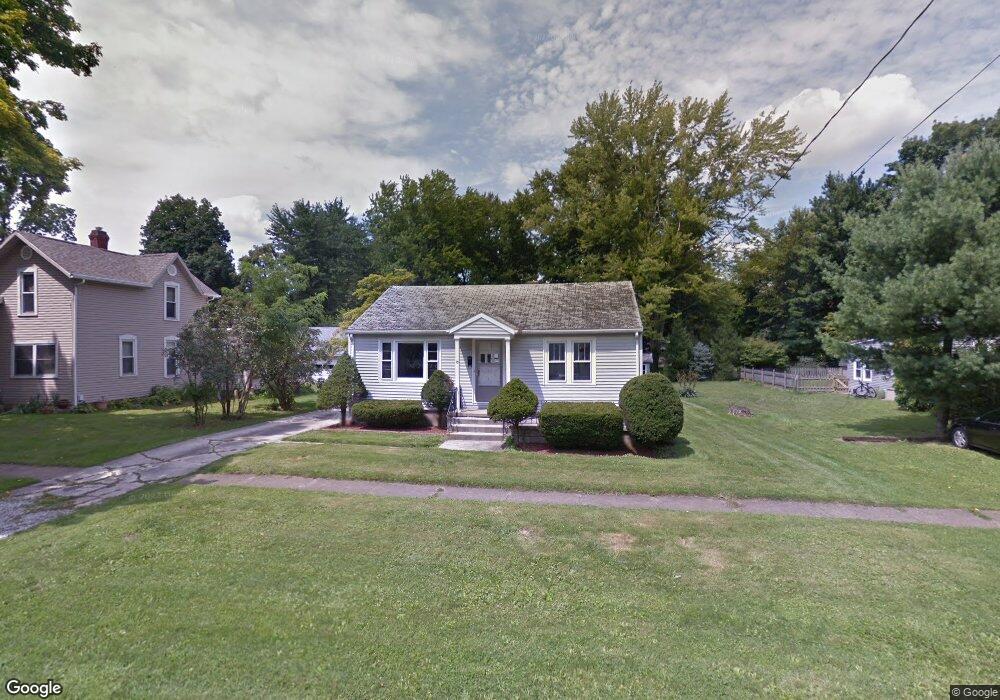
15 Olive St Norwalk, OH 44857
Estimated Value: $139,000 - $170,000
2
Beds
1
Bath
884
Sq Ft
$168/Sq Ft
Est. Value
About This Home
This home is located at 15 Olive St, Norwalk, OH 44857 and is currently estimated at $148,893, approximately $168 per square foot. 15 Olive St is a home located in Huron County with nearby schools including Maplehurst Elementary School, Pleasant Elementary School, and League Elementary School.
Ownership History
Date
Name
Owned For
Owner Type
Purchase Details
Closed on
Dec 3, 2024
Sold by
Winkler Laura E and Smith John H
Bought by
John Smith And Laura Winkler Living Trust and Smith
Current Estimated Value
Purchase Details
Closed on
Jul 27, 2016
Sold by
Goodsite Sandra Sue and Goodsite Sandra S
Bought by
Winkler Laura E and Parcher Rebecca S
Purchase Details
Closed on
Nov 19, 1998
Sold by
Est Clarence W Webber
Bought by
Goodsite Sandra S
Home Financials for this Owner
Home Financials are based on the most recent Mortgage that was taken out on this home.
Original Mortgage
$53,900
Interest Rate
6.59%
Mortgage Type
New Conventional
Purchase Details
Closed on
Aug 6, 1998
Bought by
Webber Clarence W
Purchase Details
Closed on
May 23, 1989
Bought by
Webber Clarence W
Create a Home Valuation Report for This Property
The Home Valuation Report is an in-depth analysis detailing your home's value as well as a comparison with similar homes in the area
Home Values in the Area
Average Home Value in this Area
Purchase History
| Date | Buyer | Sale Price | Title Company |
|---|---|---|---|
| John Smith And Laura Winkler Living Trust | -- | None Listed On Document | |
| Winkler Laura E | $79,700 | Attorney | |
| Goodsite Sandra S | $77,000 | -- | |
| Webber Clarence W | -- | -- | |
| Webber Clarence W | -- | -- |
Source: Public Records
Mortgage History
| Date | Status | Borrower | Loan Amount |
|---|---|---|---|
| Previous Owner | Goodsite Sandra S | $53,900 |
Source: Public Records
Tax History Compared to Growth
Tax History
| Year | Tax Paid | Tax Assessment Tax Assessment Total Assessment is a certain percentage of the fair market value that is determined by local assessors to be the total taxable value of land and additions on the property. | Land | Improvement |
|---|---|---|---|---|
| 2024 | $1,520 | $36,570 | $9,330 | $27,240 |
| 2023 | $1,520 | $29,430 | $7,070 | $22,360 |
| 2022 | $1,212 | $29,430 | $7,070 | $22,360 |
| 2021 | $1,212 | $29,430 | $7,070 | $22,360 |
| 2020 | $1,111 | $25,680 | $7,070 | $18,610 |
| 2019 | $1,088 | $25,680 | $7,070 | $18,610 |
| 2018 | $1,147 | $25,680 | $7,070 | $18,610 |
| 2017 | $1,064 | $23,570 | $7,070 | $16,500 |
| 2016 | $1,023 | $23,570 | $7,070 | $16,500 |
| 2015 | $901 | $20,060 | $7,070 | $12,990 |
| 2014 | $880 | $21,250 | $6,510 | $14,740 |
| 2013 | $768 | $21,250 | $6,510 | $14,740 |
Source: Public Records
Map
Nearby Homes