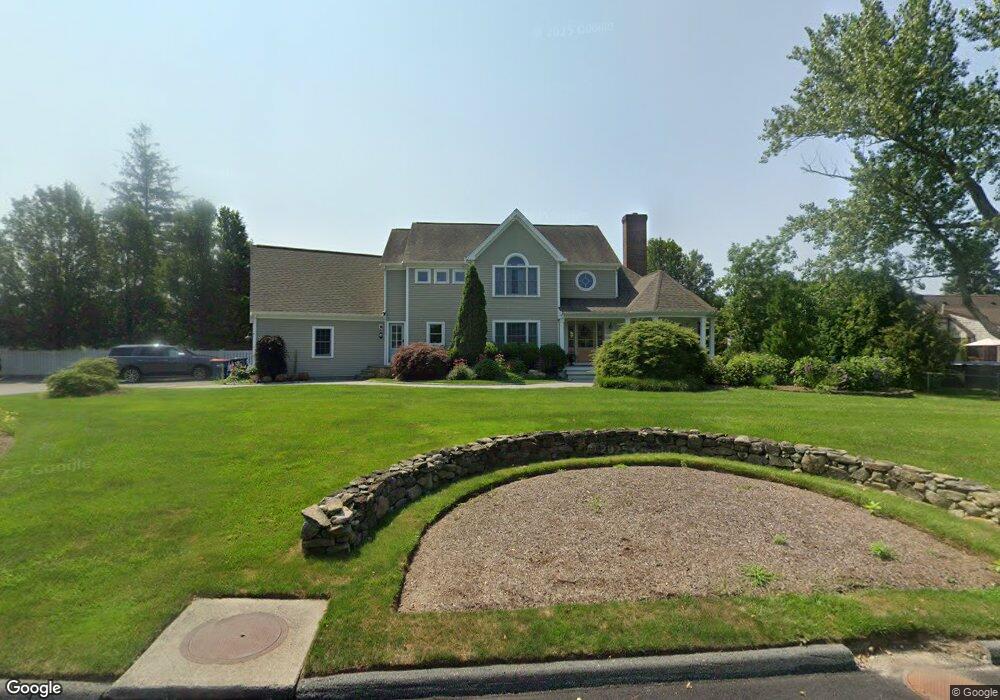
15 Oliver St Fairhaven, MA 02719
North Fairhaven NeighborhoodEstimated Value: $765,000 - $876,000
3
Beds
4
Baths
3,118
Sq Ft
$263/Sq Ft
Est. Value
About This Home
This home is located at 15 Oliver St, Fairhaven, MA 02719 and is currently estimated at $820,498, approximately $263 per square foot. 15 Oliver St is a home located in Bristol County with nearby schools including Fairhaven High School, Alma Del Mar Charter School, and St. Joseph School.
Ownership History
Date
Name
Owned For
Owner Type
Purchase Details
Closed on
Jun 28, 2024
Sold by
Muriel A Roderiques Ret and Bleure
Bought by
Shop Rt and Roderiques
Current Estimated Value
Purchase Details
Closed on
May 6, 2004
Sold by
Roderigues John
Bought by
Haggerty John F and Haggerty Tina L
Create a Home Valuation Report for This Property
The Home Valuation Report is an in-depth analysis detailing your home's value as well as a comparison with similar homes in the area
Home Values in the Area
Average Home Value in this Area
Purchase History
| Date | Buyer | Sale Price | Title Company |
|---|---|---|---|
| Shop Rt | -- | None Available | |
| Haggerty John F | $185,000 | -- | |
| Haggerty John F | $185,000 | -- |
Source: Public Records
Mortgage History
| Date | Status | Borrower | Loan Amount |
|---|---|---|---|
| Previous Owner | Haggerty John F | $105,000 | |
| Previous Owner | Haggerty John F | $119,400 |
Source: Public Records
Tax History Compared to Growth
Tax History
| Year | Tax Paid | Tax Assessment Tax Assessment Total Assessment is a certain percentage of the fair market value that is determined by local assessors to be the total taxable value of land and additions on the property. | Land | Improvement |
|---|---|---|---|---|
| 2025 | $6,681 | $716,800 | $179,200 | $537,600 |
| 2024 | $6,259 | $678,100 | $179,200 | $498,900 |
| 2023 | $6,292 | $632,400 | $157,000 | $475,400 |
| 2022 | $6,156 | $602,300 | $145,900 | $456,400 |
| 2021 | $6,035 | $534,500 | $132,000 | $402,500 |
| 2020 | $5,912 | $534,500 | $132,000 | $402,500 |
| 2019 | $5,620 | $481,600 | $109,500 | $372,100 |
| 2018 | $5,427 | $461,900 | $104,300 | $357,600 |
| 2017 | $5,505 | $457,200 | $104,300 | $352,900 |
| 2016 | $5,233 | $429,600 | $104,300 | $325,300 |
Source: Public Records
Map
Nearby Homes