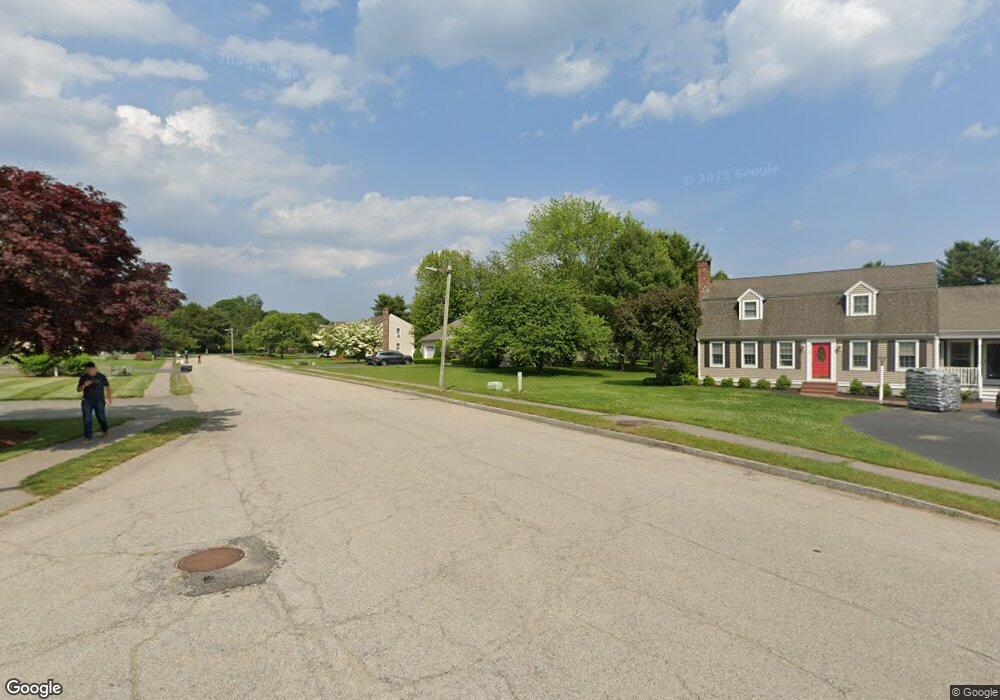
15 Orchard Dr West Bridgewater, MA 02379
Estimated Value: $636,901 - $776,000
3
Beds
3
Baths
1,972
Sq Ft
$351/Sq Ft
Est. Value
About This Home
This home is located at 15 Orchard Dr, West Bridgewater, MA 02379 and is currently estimated at $692,725, approximately $351 per square foot. 15 Orchard Dr is a home located in Plymouth County with nearby schools including Spring Street Elementary School, Howard Elementary School, and Rose L. MacDonald Elementary School.
Ownership History
Date
Name
Owned For
Owner Type
Purchase Details
Closed on
Jun 3, 2011
Sold by
Ceurvels Robert A
Bought by
Smith Eric D and Smith Jennifer A
Current Estimated Value
Home Financials for this Owner
Home Financials are based on the most recent Mortgage that was taken out on this home.
Original Mortgage
$85,000
Outstanding Balance
$59,199
Interest Rate
4.85%
Mortgage Type
Purchase Money Mortgage
Estimated Equity
$633,526
Purchase Details
Closed on
Sep 28, 1995
Sold by
Foster Lorraine F and Foster Kenneth E
Bought by
Ceurvels Robert A and Ceurvels Carol A
Home Financials for this Owner
Home Financials are based on the most recent Mortgage that was taken out on this home.
Original Mortgage
$60,000
Interest Rate
7.89%
Mortgage Type
Purchase Money Mortgage
Purchase Details
Closed on
May 15, 1991
Sold by
Hazard & Boyle Rt
Bought by
Foster Kenneth E and Foster Lorraine F
Create a Home Valuation Report for This Property
The Home Valuation Report is an in-depth analysis detailing your home's value as well as a comparison with similar homes in the area
Home Values in the Area
Average Home Value in this Area
Purchase History
| Date | Buyer | Sale Price | Title Company |
|---|---|---|---|
| Smith Eric D | $387,500 | -- | |
| Ceurvels Robert A | $205,000 | -- | |
| Foster Kenneth E | $85,000 | -- |
Source: Public Records
Mortgage History
| Date | Status | Borrower | Loan Amount |
|---|---|---|---|
| Open | Smith Eric D | $85,000 | |
| Previous Owner | Foster Kenneth E | $60,000 |
Source: Public Records
Tax History Compared to Growth
Tax History
| Year | Tax Paid | Tax Assessment Tax Assessment Total Assessment is a certain percentage of the fair market value that is determined by local assessors to be the total taxable value of land and additions on the property. | Land | Improvement |
|---|---|---|---|---|
| 2025 | $7,498 | $548,500 | $233,900 | $314,600 |
| 2024 | $7,353 | $518,900 | $213,400 | $305,500 |
| 2023 | $7,043 | $458,200 | $190,800 | $267,400 |
| 2022 | $7,012 | $432,300 | $182,600 | $249,700 |
| 2021 | $4,641 | $409,500 | $182,600 | $226,900 |
| 2020 | $4,422 | $420,900 | $182,600 | $238,300 |
| 2019 | $6,805 | $411,700 | $182,600 | $229,100 |
| 2018 | $4,223 | $386,200 | $164,100 | $222,100 |
| 2017 | $4,159 | $370,200 | $153,900 | $216,300 |
| 2016 | $6,478 | $359,900 | $143,600 | $216,300 |
| 2015 | $6,273 | $352,200 | $143,600 | $208,600 |
| 2014 | $5,808 | $352,200 | $143,600 | $208,600 |
Source: Public Records
Map
Nearby Homes