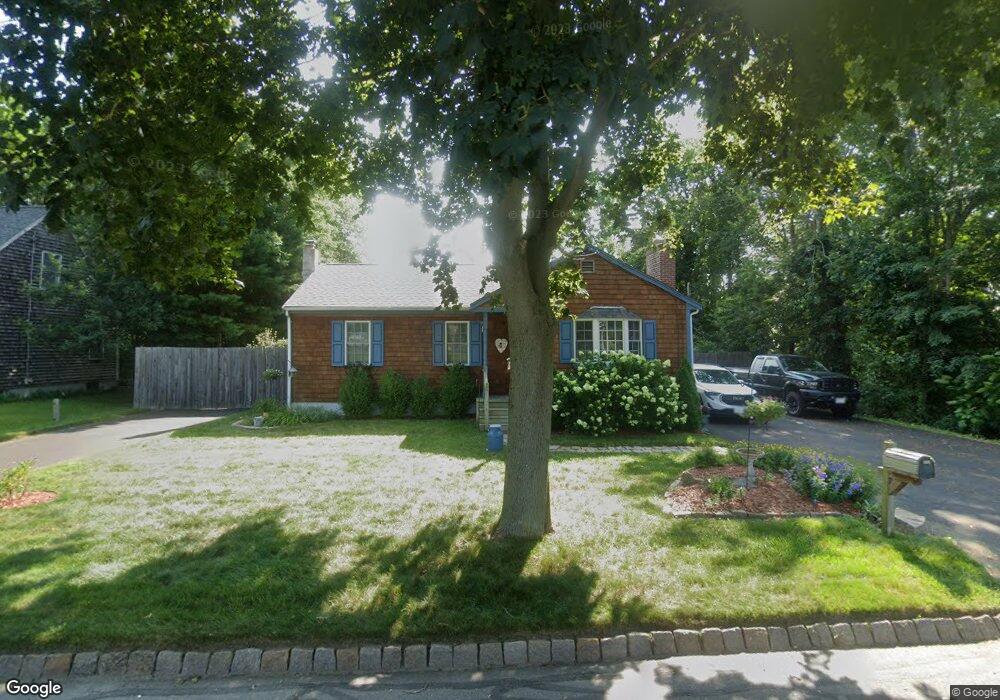
15 Parker St Fairhaven, MA 02719
North Fairhaven NeighborhoodEstimated Value: $389,000 - $450,426
3
Beds
1
Bath
1,031
Sq Ft
$409/Sq Ft
Est. Value
About This Home
This home is located at 15 Parker St, Fairhaven, MA 02719 and is currently estimated at $421,857, approximately $409 per square foot. 15 Parker St is a home located in Bristol County with nearby schools including Fairhaven High School, Alma Del Mar Charter School, and St. Joseph School.
Ownership History
Date
Name
Owned For
Owner Type
Purchase Details
Closed on
Jun 8, 2016
Sold by
Medeiros Sandra L and Medeiros Jamie
Bought by
Medeiros Jamie
Current Estimated Value
Purchase Details
Closed on
Nov 15, 1999
Sold by
Medeiros Antonio and Medeiros Felicia W
Bought by
Medeiros Sandra L and Medeiros Jamie
Home Financials for this Owner
Home Financials are based on the most recent Mortgage that was taken out on this home.
Original Mortgage
$95,000
Interest Rate
7.68%
Mortgage Type
Purchase Money Mortgage
Create a Home Valuation Report for This Property
The Home Valuation Report is an in-depth analysis detailing your home's value as well as a comparison with similar homes in the area
Home Values in the Area
Average Home Value in this Area
Purchase History
| Date | Buyer | Sale Price | Title Company |
|---|---|---|---|
| Medeiros Jamie | -- | -- | |
| Medeiros Sandra L | $100,000 | -- |
Source: Public Records
Mortgage History
| Date | Status | Borrower | Loan Amount |
|---|---|---|---|
| Previous Owner | Medeiros Sandra L | $151,500 | |
| Previous Owner | Medeiros Sandra L | $172,000 | |
| Previous Owner | Medeiros Sandra L | $92,400 | |
| Previous Owner | Medeiros Sandra L | $95,000 |
Source: Public Records
Tax History Compared to Growth
Tax History
| Year | Tax Paid | Tax Assessment Tax Assessment Total Assessment is a certain percentage of the fair market value that is determined by local assessors to be the total taxable value of land and additions on the property. | Land | Improvement |
|---|---|---|---|---|
| 2025 | $35 | $371,200 | $176,200 | $195,000 |
| 2024 | $3,219 | $348,800 | $176,200 | $172,600 |
| 2023 | $3,091 | $310,700 | $154,400 | $156,300 |
| 2022 | $2,938 | $287,500 | $143,500 | $144,000 |
| 2021 | $2,824 | $250,100 | $129,800 | $120,300 |
| 2020 | $2,766 | $250,100 | $129,800 | $120,300 |
| 2019 | $2,633 | $225,600 | $107,700 | $117,900 |
| 2018 | $2,526 | $215,000 | $102,500 | $112,500 |
| 2017 | $2,533 | $210,400 | $102,500 | $107,900 |
| 2016 | $2,505 | $205,700 | $102,500 | $103,200 |
| 2015 | $2,479 | $204,000 | $102,500 | $101,500 |
Source: Public Records
Map
Nearby Homes