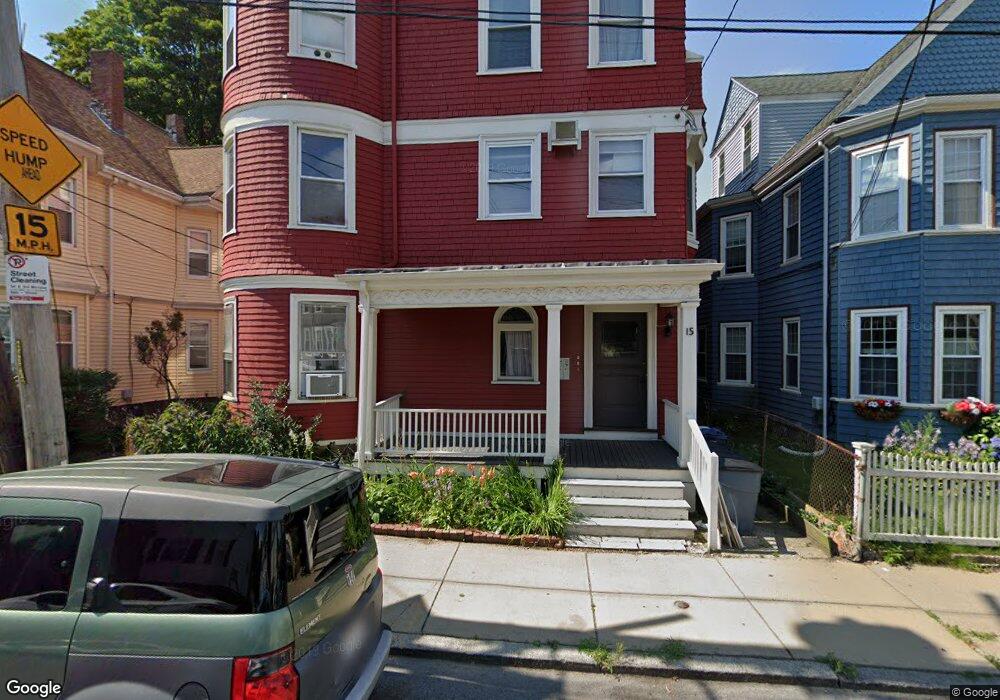
15 Paul Gore St Unit 2 Jamaica Plain, MA 02130
Jamaica Plain NeighborhoodEstimated Value: $759,213 - $822,000
About This Home
Spacious and beautifully renovated 3 bed condo for rent that has a great and huge front office room. Located near Whole Foods, this large apartment on the second floor has high ceilings, very big and sunny kitchen with stainless steel appliances and open shelving/cabinets. Kitchen has access to a great back deck with views of the shared backyard. The condo features wood floors, newer windows, bathroom and kitchen that have been renovated 4-5 years ago, living room with bay windows, that bring lots of light in. Great outdoor space for entertainment. Oil heat, gas for cooking and electricity are not included in the rent. All three bedrooms have good sized closets. There is an additional office space with a closet or storage space. In unit washer/dryer. Perfectly located near Whole Foods, Stony Brook T station, near Hyde Square restaurants, Tres Gatos and CVS, 7 Eleven all around the corner. Available for July 1 or any time after June 10First month rent, security deposit and one month rent broker fee to move in.
Ownership History
Purchase Details
Home Values in the Area
Average Home Value in this Area
Purchase History
| Date | Buyer | Sale Price | Title Company |
|---|---|---|---|
| Peralta Marisa | -- | -- |
Property History
| Date | Event | Price | List to Sale | Price per Sq Ft |
|---|---|---|---|---|
| 06/09/2025 06/09/25 | Off Market | $4,000 | -- | -- |
| 05/07/2025 05/07/25 | For Rent | $4,000 | -- | -- |
Tax History Compared to Growth
Tax History
| Year | Tax Paid | Tax Assessment Tax Assessment Total Assessment is a certain percentage of the fair market value that is determined by local assessors to be the total taxable value of land and additions on the property. | Land | Improvement |
|---|---|---|---|---|
| 2025 | $7,696 | $664,600 | $0 | $664,600 |
| 2024 | $6,327 | $580,500 | $0 | $580,500 |
| 2023 | $5,936 | $552,700 | $0 | $552,700 |
| 2022 | $5,673 | $521,400 | $0 | $521,400 |
| 2021 | $4,818 | $451,500 | $0 | $451,500 |
| 2020 | $4,773 | $452,000 | $0 | $452,000 |
| 2019 | $4,580 | $434,500 | $0 | $434,500 |
| 2018 | $4,422 | $421,900 | $0 | $421,900 |
| 2017 | $4,216 | $398,100 | $0 | $398,100 |
| 2016 | $4,092 | $372,000 | $0 | $372,000 |
| 2015 | $3,864 | $319,100 | $0 | $319,100 |
| 2014 | $3,785 | $300,900 | $0 | $300,900 |
Map
- 68 Perkins St Unit 1
- 43 Boylston St
- 12 Zamora St
- 32 Forbes St
- 11 Spring Park Ave Unit B
- 10 Bynner St
- 23 Burr St
- 65-67 Halifax St
- 343 S Huntington Ave Unit 7
- 11 Robinwood Ave
- 24 Evergreen St Unit 2
- 90 Bynner St Unit 7
- 332 Jamaicaway Unit 406
- 70 Day St Unit 2
- 70 Day St
- 70 Day St Unit 1
- 3 Kenney St Unit 2
- 71 Mozart St Unit 3
- 111 Perkins St Unit 108
- 111 Perkins St Unit 282
- 15 Paul Gore St Unit 3
- 15 Paul Gore St Unit 1
- 19 Paul Gore St
- 19 Paul Gore St
- 19 Paul Gore St Unit 3
- 19 Paul Gore St Unit 1
- 11 Paul Gore St Unit 3
- 11 Paul Gore St Unit 2
- 11 Paul Gore St Unit 1
- 23 Paul Gore St Unit 3
- 23 Paul Gore St Unit 2
- 23 Paul Gore St Unit 1
- 23 Paul Gore St
- 6 Oakview Terrace Unit 1
- 8 Oakview Terrace Unit 2
- 10 Oakview Terrace Unit 3
- 10 Oakview Terrace
- 10 Oakview Terrace
- 10 Oakview Terrace Unit 1
- 10 Oakview Terrace Unit 2