Estimated Value: $534,000 - $638,000
3
Beds
3
Baths
2,950
Sq Ft
$201/Sq Ft
Est. Value
About This Home
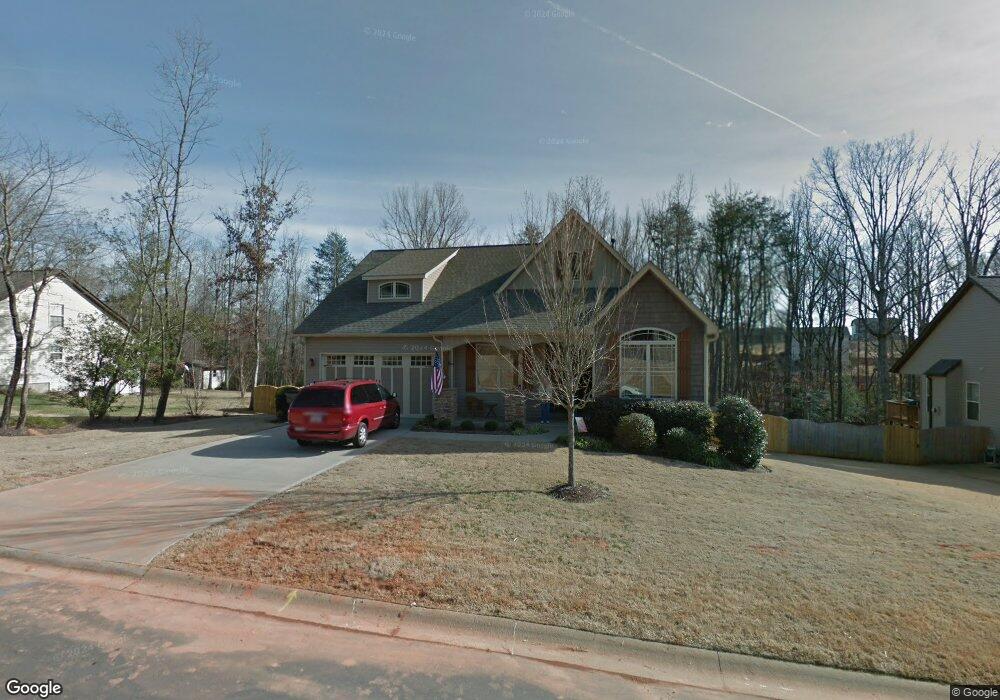
This home is located at 15 Pebblebrook Ct, Greer, SC 29651 and is currently estimated at $592,489, approximately $200 per square foot. 15 Pebblebrook Ct is a home located in Greenville County with nearby schools including Skyland Elementary School, Blue Ridge Middle School, and Blue Ridge High School.
Ownership History
Date
Name
Owned For
Owner Type
Purchase Details
Closed on
Feb 4, 2015
Sold by
Munzenmayer Bernd G and Munzenmayer Karolina
Bought by
Levin Richard C and Levin Tanya Y
Current Estimated Value
Purchase Details
Closed on
May 15, 2012
Sold by
Pound Thomas Patrick and Pound Susan Anne
Bought by
Munzemayer Bernd G and Munzenmayer Karolina
Purchase Details
Closed on
Feb 26, 2009
Sold by
Atima Homes Llc
Bought by
Pound Thomas Patrick and Pound Susan Anne
Home Financials for this Owner
Home Financials are based on the most recent Mortgage that was taken out on this home.
Original Mortgage
$234,804
Interest Rate
5.03%
Mortgage Type
FHA
Purchase Details
Closed on
Dec 12, 2008
Sold by
Rosewood Of The Piedmont Inc
Bought by
Atima Homes Llc
Home Financials for this Owner
Home Financials are based on the most recent Mortgage that was taken out on this home.
Original Mortgage
$193,600
Interest Rate
6.38%
Mortgage Type
Construction
Create a Home Valuation Report for This Property
The Home Valuation Report is an in-depth analysis detailing your home's value as well as a comparison with similar homes in the area
Home Values in the Area
Average Home Value in this Area
Purchase History
| Date | Buyer | Sale Price | Title Company |
|---|---|---|---|
| Levin Richard C | $290,000 | -- | |
| Munzemayer Bernd G | $265,000 | -- | |
| Pound Thomas Patrick | $239,136 | -- | |
| Atima Homes Llc | $40,000 | -- |
Source: Public Records
Mortgage History
| Date | Status | Borrower | Loan Amount |
|---|---|---|---|
| Previous Owner | Pound Thomas Patrick | $234,804 | |
| Previous Owner | Atima Homes Llc | $193,600 |
Source: Public Records
Tax History
| Year | Tax Paid | Tax Assessment Tax Assessment Total Assessment is a certain percentage of the fair market value that is determined by local assessors to be the total taxable value of land and additions on the property. | Land | Improvement |
|---|---|---|---|---|
| 2025 | $2,522 | $17,040 | $2,300 | $14,740 |
| 2024 | $2,522 | $14,820 | $1,300 | $13,520 |
| 2023 | $2,435 | $14,820 | $1,300 | $13,520 |
| 2022 | $2,269 | $14,820 | $1,300 | $13,520 |
| 2021 | $2,246 | $14,820 | $1,300 | $13,520 |
| 2020 | $2,059 | $12,890 | $1,080 | $11,810 |
| 2019 | $2,046 | $12,890 | $1,080 | $11,810 |
| 2018 | $2,041 | $12,890 | $1,080 | $11,810 |
| 2017 | $1,991 | $12,890 | $1,080 | $11,810 |
| 2016 | $1,917 | $322,180 | $27,000 | $295,180 |
| 2015 | $1,722 | $289,070 | $27,000 | $262,070 |
| 2014 | $1,846 | $311,740 | $38,610 | $273,130 |
Source: Public Records
Map
Nearby Homes
- 30 Arbolado Way
- 3611 Pennington Rd
- 3 Tampico Ct
- 149 Country Mist Dr
- 240 Clearridge Way
- 3400 Pennington Rd
- 60 William Owens Way
- 2 Hunters Landing Dr
- 100 Clearridge Way
- 2355 Mays Bridge Rd
- 3796 Camp Rd
- 205 Daystrom Dr
- 3902 N Highway 101
- 3900 N Highway 101
- 307 Novelty Dr
- 309 Novelty Dr
- 313 Novelty Dr
- 0 Edwards Lake Rd
- 510 Meritage St
- 3836 Pennington Rd
- 19 Pebblebrook Ct
- 9 Pebblebrook Ct
- 16 Pebblebrook Ct
- 8 Pebblebrook Ct
- 23 Pebblebrook Ct
- 22 Pebblebrook Ct
- 5 Pebblebrook Ct
- 27 Pebblebrook Ct
- 2 Pebblebrook Ct
- 26 Pebblebrook Ct
- 30 Pebblebrook Ct
- 216 Bayswater Ln
- 1 Pebblebrook Ct
- 31 Pebblebrook Ct
- 208 Watercourse Way
- 212 Watercourse Way
- 304 Bayswater Ln
- 212 Bayswater Ln
- 216 Watercourse Way
- 200 Watercourse Way
Your Personal Tour Guide
Ask me questions while you tour the home.