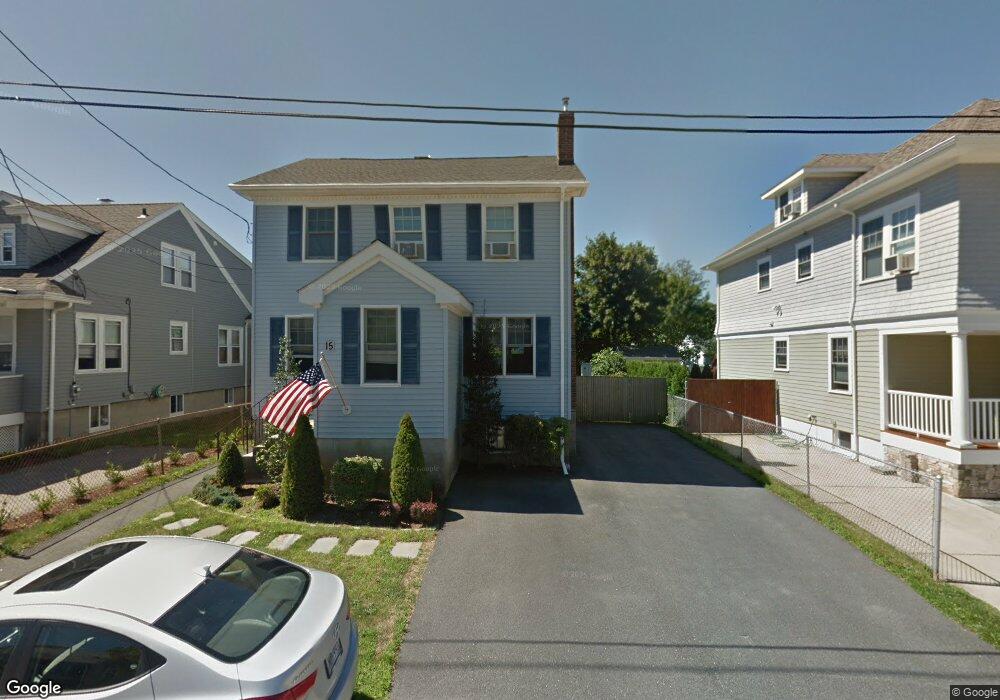
15 Pennacook St Newport, RI 02840
North End Residential NeighborhoodEstimated Value: $711,000 - $933,000
3
Beds
2
Baths
1,354
Sq Ft
$584/Sq Ft
Est. Value
About This Home
This home is located at 15 Pennacook St, Newport, RI 02840 and is currently estimated at $790,660, approximately $583 per square foot. 15 Pennacook St is a home located in Newport County with nearby schools including Rogers High School, St Michael's Country Day School, and All Saints STEAM Academy.
Ownership History
Date
Name
Owned For
Owner Type
Purchase Details
Closed on
Apr 10, 2015
Sold by
Gollub Ian and Gollub Caroline
Bought by
Mckenna Kyle G
Current Estimated Value
Home Financials for this Owner
Home Financials are based on the most recent Mortgage that was taken out on this home.
Original Mortgage
$224,000
Outstanding Balance
$172,627
Interest Rate
3.77%
Mortgage Type
New Conventional
Estimated Equity
$618,033
Purchase Details
Closed on
Jun 11, 2013
Sold by
Mahoney Christopher M and Mahoney Katie M
Bought by
Flynn John D
Home Financials for this Owner
Home Financials are based on the most recent Mortgage that was taken out on this home.
Original Mortgage
$286,020
Interest Rate
3.43%
Mortgage Type
New Conventional
Create a Home Valuation Report for This Property
The Home Valuation Report is an in-depth analysis detailing your home's value as well as a comparison with similar homes in the area
Home Values in the Area
Average Home Value in this Area
Purchase History
| Date | Buyer | Sale Price | Title Company |
|---|---|---|---|
| Mckenna Kyle G | $283,000 | -- | |
| Flynn John D | $280,000 | -- |
Source: Public Records
Mortgage History
| Date | Status | Borrower | Loan Amount |
|---|---|---|---|
| Open | Flynn John D | $224,000 | |
| Previous Owner | Flynn John D | $286,020 |
Source: Public Records
Tax History Compared to Growth
Tax History
| Year | Tax Paid | Tax Assessment Tax Assessment Total Assessment is a certain percentage of the fair market value that is determined by local assessors to be the total taxable value of land and additions on the property. | Land | Improvement |
|---|---|---|---|---|
| 2025 | $5,897 | $678,700 | $211,300 | $467,400 |
| 2024 | $5,579 | $678,700 | $211,300 | $467,400 |
| 2023 | $4,499 | $453,500 | $149,400 | $304,100 |
| 2022 | $4,358 | $453,500 | $149,400 | $304,100 |
| 2021 | $4,231 | $453,500 | $149,400 | $304,100 |
| 2020 | $3,383 | $329,100 | $128,900 | $200,200 |
| 2019 | $3,383 | $329,100 | $128,900 | $200,200 |
| 2018 | $3,288 | $329,100 | $128,900 | $200,200 |
| 2017 | $3,003 | $267,900 | $75,300 | $192,600 |
| 2016 | $2,928 | $267,900 | $75,300 | $192,600 |
| 2015 | $2,852 | $267,300 | $75,300 | $192,000 |
| 2014 | $3,040 | $252,100 | $67,400 | $184,700 |
Source: Public Records
Map
Nearby Homes
- 5 Elliot Place
- 155 Evarts St
- 7 Sheffield Ave
- 1 Arnold Ave
- 19 Princeton St Unit 21
- 117 W Main Rd
- 149 W Main Rd
- 125 Van Zandt Ave Unit 307
- 66 Girard Ave Unit 401
- 26 Prescott Hall Rd
- 1 Shangri-La Ln
- 4 Newport Ave Unit B2
- 3 Vicksburg Place
- 67 Linden St
- 53 Warner St
- 44 Warner St
- 17 Lincoln St
- 5 Bowser Ct
- 17 Mariner Way
- 138 Green End Ave