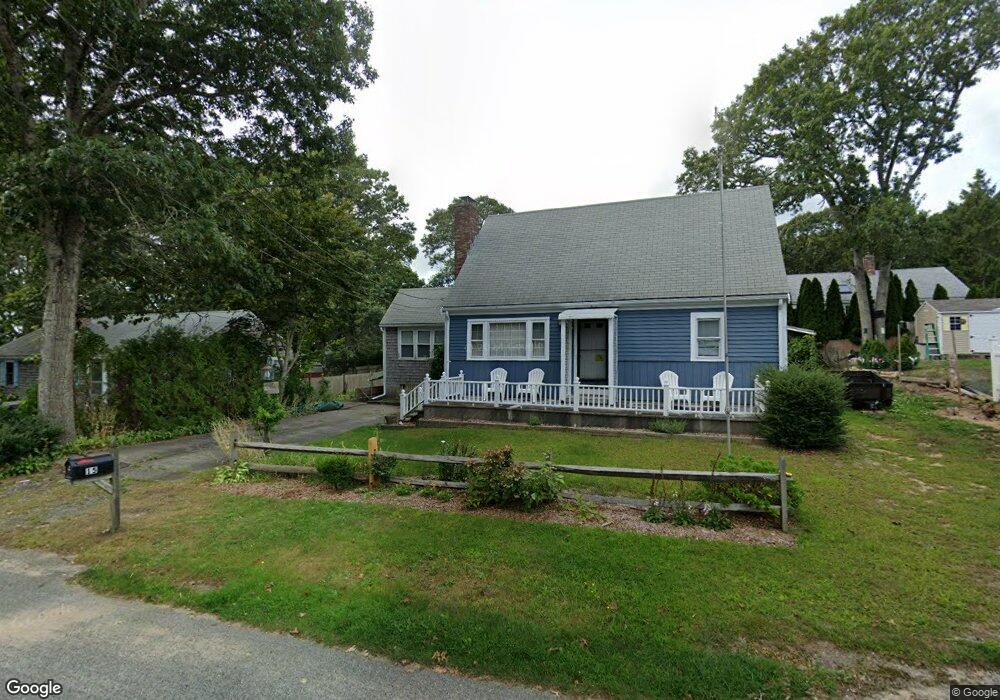
15 Peter Oliver Rd South Dennis, MA 02660
South Dennis NeighborhoodEstimated Value: $524,000 - $645,000
2
Beds
2
Baths
1,600
Sq Ft
$359/Sq Ft
Est. Value
About This Home
This home is located at 15 Peter Oliver Rd, South Dennis, MA 02660 and is currently estimated at $574,476, approximately $359 per square foot. 15 Peter Oliver Rd is a home located in Barnstable County with nearby schools including Dennis-Yarmouth Regional High School and St. Pius X. School.
Ownership History
Date
Name
Owned For
Owner Type
Purchase Details
Closed on
Nov 24, 2021
Sold by
Dangona Samuel L Est and Vanwickle
Bought by
Dangona Paul S
Current Estimated Value
Home Financials for this Owner
Home Financials are based on the most recent Mortgage that was taken out on this home.
Original Mortgage
$248,000
Outstanding Balance
$226,964
Interest Rate
3.05%
Mortgage Type
Purchase Money Mortgage
Estimated Equity
$347,512
Purchase Details
Closed on
Jul 18, 1978
Bought by
Dangona Samuel L and Dangona Eleanor L
Create a Home Valuation Report for This Property
The Home Valuation Report is an in-depth analysis detailing your home's value as well as a comparison with similar homes in the area
Home Values in the Area
Average Home Value in this Area
Purchase History
| Date | Buyer | Sale Price | Title Company |
|---|---|---|---|
| Dangona Paul S | $360,000 | None Available | |
| Dangona Paul S | $360,000 | None Available | |
| Dangona Samuel L | -- | -- |
Source: Public Records
Mortgage History
| Date | Status | Borrower | Loan Amount |
|---|---|---|---|
| Open | Dangona Paul S | $248,000 | |
| Closed | Dangona Paul S | $248,000 |
Source: Public Records
Tax History Compared to Growth
Tax History
| Year | Tax Paid | Tax Assessment Tax Assessment Total Assessment is a certain percentage of the fair market value that is determined by local assessors to be the total taxable value of land and additions on the property. | Land | Improvement |
|---|---|---|---|---|
| 2025 | $2,696 | $622,600 | $212,900 | $409,700 |
| 2024 | $2,680 | $610,400 | $204,800 | $405,600 |
| 2023 | $2,766 | $592,200 | $223,400 | $368,800 |
| 2022 | $2,631 | $469,900 | $195,600 | $274,300 |
| 2021 | $2,467 | $409,200 | $191,800 | $217,400 |
| 2020 | $2,253 | $369,300 | $164,400 | $204,900 |
| 2019 | $1,923 | $311,600 | $129,000 | $182,600 |
| 2018 | $1,756 | $276,900 | $102,300 | $174,600 |
| 2017 | $1,703 | $276,900 | $102,300 | $174,600 |
| 2016 | $1,521 | $233,000 | $107,400 | $125,600 |
| 2015 | $1,491 | $233,000 | $107,400 | $125,600 |
| 2014 | $1,505 | $237,000 | $92,100 | $144,900 |
Source: Public Records
Map
Nearby Homes
- 26 Olivia Walker Way
- 153 Bayridge Dr
- 4 Ebb Rd
- 11 Uncle Stanleys Way
- 17 Margate Ln
- 15 Captain Jud Rd
- 118 Driftwood Ln
- 129 Driftwood Ln
- 17 Fairmount Rd
- 13 Covey Dr
- 17 Fairmount Rd
- 111 Merchant Ave
- 10 Joanne Dr
- 7 Vinland Dr
- 25 Skerry Rd
- 1 Norseman Dr
- 4 Old Colony Way
- 6 Nimble Hill Dr
- 62 Old Fish House Rd
- 6 Hawthorn St
- 13 Peter Oliver Rd
- 19 Peter Oliver Rd
- 16 Longview Dr
- 22 Peter Oliver Rd
- 20 Peter Oliver Rd
- 9 Peter Oliver Rd
- 98 Alfred Metcalf Dr
- 16 Peter Oliver Rd
- 20 Longview Dr
- 8 Longview Dr
- 25 Peter Oliver Rd
- 23 Norse Rd
- 15 Longview Dr
- 5 Peter Oliver Rd
- 94 Alfred Metcalf Dr
- 12 Peter Oliver Rd
- 19 Norse Rd
- 2 Longview Dr
- 32 Peter Oliver Rd
- 4 Rose Arbor Rd