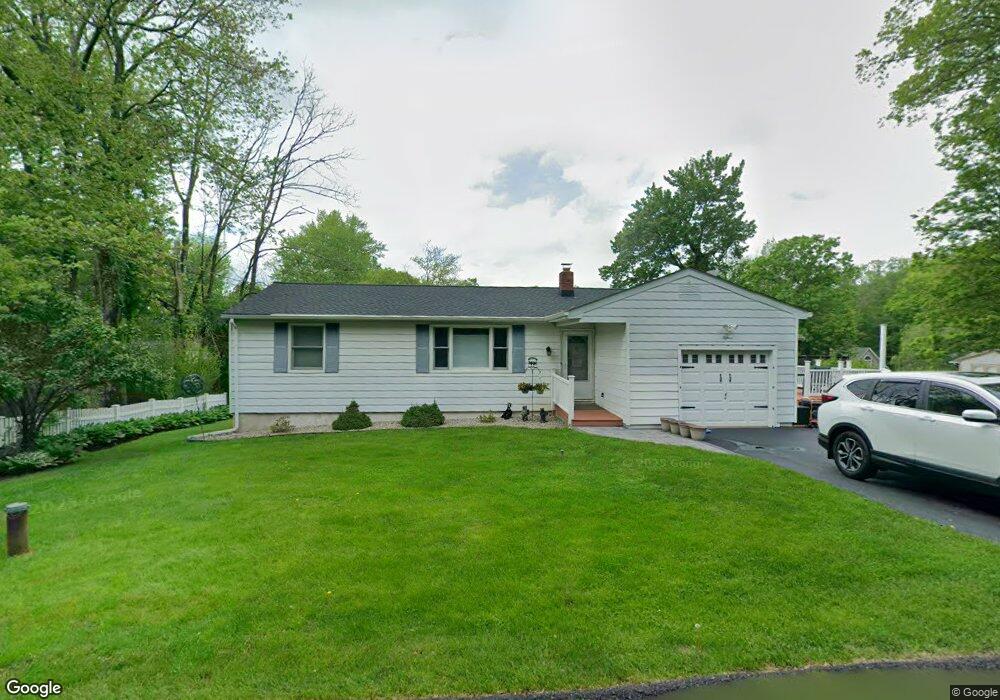
15 Pierson Dr Byram Township, NJ 07821
Estimated Value: $274,000 - $362,000
--
Bed
--
Bath
816
Sq Ft
$394/Sq Ft
Est. Value
About This Home
This home is located at 15 Pierson Dr, Byram Township, NJ 07821 and is currently estimated at $321,787, approximately $394 per square foot. 15 Pierson Dr is a home located in Sussex County with nearby schools including Byram Lakes Elementary School, Byram Township Intermediate School, and Lenape Val Regional High School.
Ownership History
Date
Name
Owned For
Owner Type
Purchase Details
Closed on
Nov 15, 2000
Sold by
Fralley Todd R and Fralley Dawn R
Bought by
Bruner Richard and Devaney Diane
Current Estimated Value
Home Financials for this Owner
Home Financials are based on the most recent Mortgage that was taken out on this home.
Original Mortgage
$147,250
Outstanding Balance
$53,794
Interest Rate
7.76%
Mortgage Type
Stand Alone First
Estimated Equity
$267,993
Purchase Details
Closed on
Oct 10, 1997
Sold by
Mccreery Adam and Mccreery Deborah
Bought by
Fralley Todd R and Fralley Dawn R
Home Financials for this Owner
Home Financials are based on the most recent Mortgage that was taken out on this home.
Original Mortgage
$119,800
Interest Rate
7.46%
Mortgage Type
FHA
Create a Home Valuation Report for This Property
The Home Valuation Report is an in-depth analysis detailing your home's value as well as a comparison with similar homes in the area
Home Values in the Area
Average Home Value in this Area
Purchase History
| Date | Buyer | Sale Price | Title Company |
|---|---|---|---|
| Bruner Richard | $155,000 | -- | |
| Fralley Todd R | $120,000 | Colonial Title & Abstract |
Source: Public Records
Mortgage History
| Date | Status | Borrower | Loan Amount |
|---|---|---|---|
| Open | Bruner Richard | $147,250 | |
| Previous Owner | Fralley Todd R | $119,800 |
Source: Public Records
Tax History Compared to Growth
Tax History
| Year | Tax Paid | Tax Assessment Tax Assessment Total Assessment is a certain percentage of the fair market value that is determined by local assessors to be the total taxable value of land and additions on the property. | Land | Improvement |
|---|---|---|---|---|
| 2025 | $7,020 | $183,300 | $107,700 | $75,600 |
| 2024 | $6,896 | $183,300 | $107,700 | $75,600 |
| 2023 | $6,896 | $183,300 | $107,700 | $75,600 |
| 2022 | $6,709 | $183,300 | $107,700 | $75,600 |
| 2021 | $6,606 | $183,300 | $107,700 | $75,600 |
| 2020 | $6,551 | $183,300 | $107,700 | $75,600 |
| 2019 | $6,542 | $183,300 | $107,700 | $75,600 |
| 2018 | $6,498 | $183,300 | $107,700 | $75,600 |
| 2017 | $6,384 | $183,300 | $107,700 | $75,600 |
| 2016 | $6,278 | $183,300 | $107,700 | $75,600 |
| 2015 | $6,120 | $183,300 | $107,700 | $75,600 |
| 2014 | $6,087 | $183,300 | $107,700 | $75,600 |
Source: Public Records
Map
Nearby Homes
- 3 Knute Dr
- 3 Roger Dr
- 7 Lakeview Trail
- 34 Allamuchy Trail
- 4 Bank St
- 9 Richmond Rd
- 56A Sleepy Hollow Rd
- 00 Forest Lakes Dr
- 7 U S Highway 206
- 24 the Rotunda
- 40 Brookwood Rd
- 288 Decker Pond Rd
- 11 Joan Dr
- 30 Ross Rd
- 2 Robert St
- 28 Acorn St
- 52 River Rd
- 14 Hillside Terrace
- 0 Decker Pond Airport Rd Unit 3945534
- 9160 Ashland Ct Unit 160