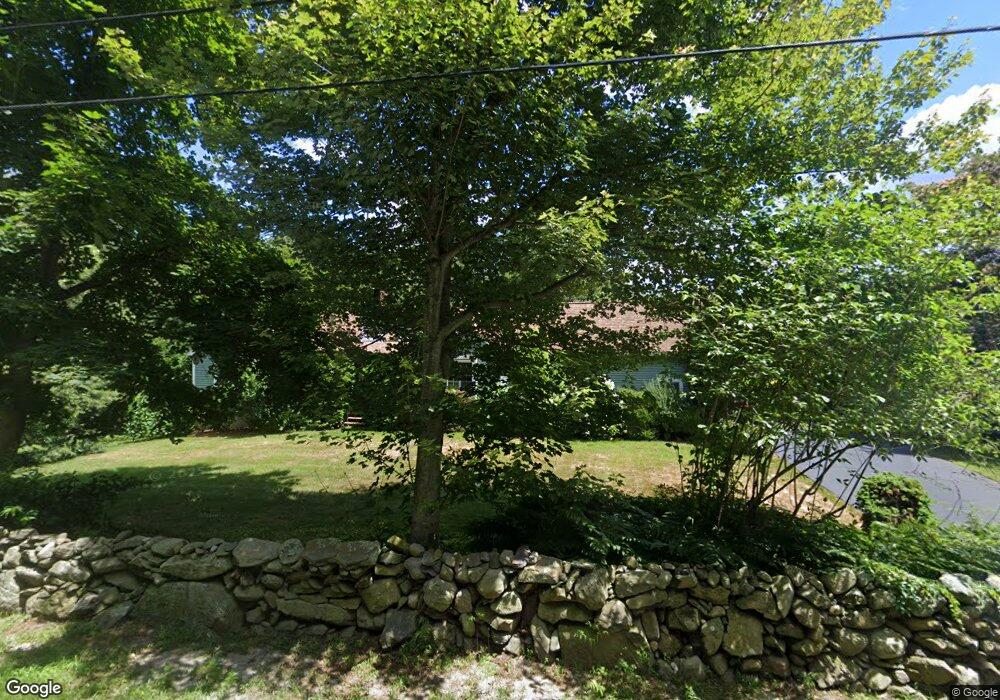
15 Pine St Rehoboth, MA 02769
Estimated Value: $641,368 - $887,000
3
Beds
2
Baths
2,065
Sq Ft
$357/Sq Ft
Est. Value
About This Home
This home is located at 15 Pine St, Rehoboth, MA 02769 and is currently estimated at $736,592, approximately $356 per square foot. 15 Pine St is a home located in Bristol County with nearby schools including Dighton-Rehoboth Regional High School, St Cecilia School, and St Margaret School.
Ownership History
Date
Name
Owned For
Owner Type
Purchase Details
Closed on
Jun 9, 1999
Sold by
Gilligan John J and Gilligan Amelia L
Bought by
Gallagher Diane J and Poitras Paul L
Current Estimated Value
Home Financials for this Owner
Home Financials are based on the most recent Mortgage that was taken out on this home.
Original Mortgage
$206,550
Interest Rate
6.9%
Mortgage Type
Purchase Money Mortgage
Purchase Details
Closed on
Aug 18, 1989
Sold by
Countryside Homes
Bought by
Gilligan John J
Create a Home Valuation Report for This Property
The Home Valuation Report is an in-depth analysis detailing your home's value as well as a comparison with similar homes in the area
Home Values in the Area
Average Home Value in this Area
Purchase History
| Date | Buyer | Sale Price | Title Company |
|---|---|---|---|
| Gallagher Diane J | $229,500 | -- | |
| Gilligan John J | $209,900 | -- |
Source: Public Records
Mortgage History
| Date | Status | Borrower | Loan Amount |
|---|---|---|---|
| Open | Gilligan John J | $200,000 | |
| Closed | Gilligan John J | $206,550 | |
| Previous Owner | Gilligan John J | $157,300 | |
| Previous Owner | Gilligan John J | $15,504 |
Source: Public Records
Tax History
| Year | Tax Paid | Tax Assessment Tax Assessment Total Assessment is a certain percentage of the fair market value that is determined by local assessors to be the total taxable value of land and additions on the property. | Land | Improvement |
|---|---|---|---|---|
| 2025 | $63 | $564,700 | $191,500 | $373,200 |
| 2024 | $6,246 | $549,800 | $191,500 | $358,300 |
| 2023 | $6,115 | $528,100 | $187,500 | $340,600 |
| 2022 | $5,927 | $467,800 | $179,100 | $288,700 |
| 2021 | $4,465 | $426,500 | $162,800 | $263,700 |
| 2020 | $5,374 | $409,600 | $162,800 | $246,800 |
| 2018 | $2,298 | $401,800 | $155,000 | $246,800 |
| 2017 | $4,406 | $350,800 | $155,000 | $195,800 |
| 2016 | $4,335 | $356,800 | $155,000 | $201,800 |
| 2015 | $4,093 | $332,500 | $147,800 | $184,700 |
| 2014 | $3,996 | $321,200 | $140,600 | $180,600 |
Source: Public Records
Map
Nearby Homes
Your Personal Tour Guide
Ask me questions while you tour the home.