Estimated Value: $141,363 - $205,000
--
Bed
--
Bath
1,261
Sq Ft
$144/Sq Ft
Est. Value
About This Home
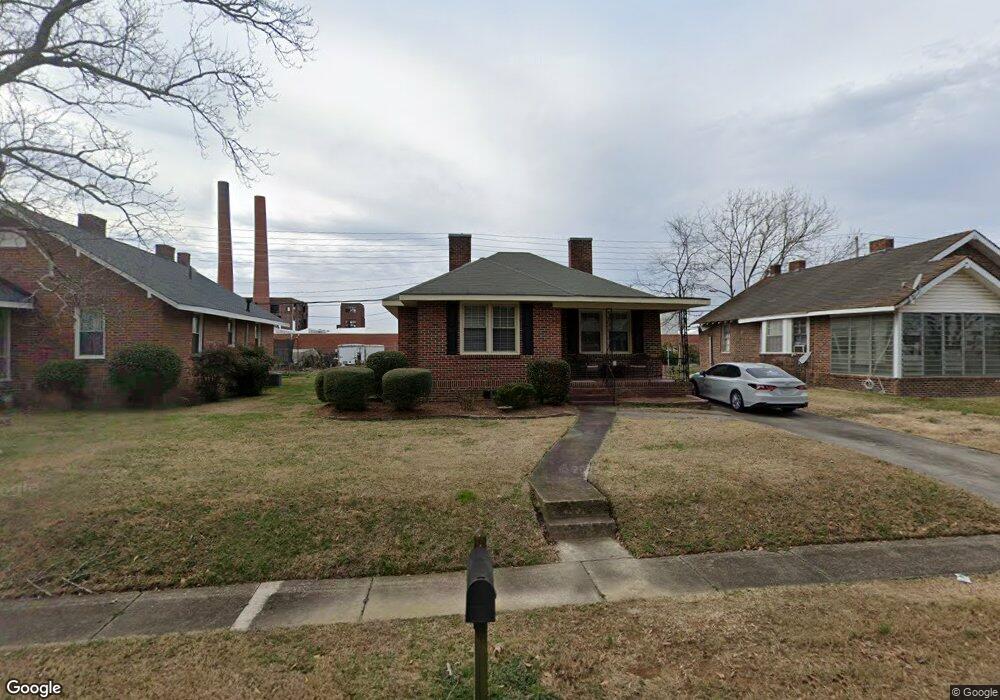
This home is located at 15 Poplar St NE, Rome, GA 30161 and is currently estimated at $181,341, approximately $143 per square foot. 15 Poplar St NE is a home located in Floyd County with nearby schools including Model Middle School, Model High School, and Unity Christian School.
Ownership History
Date
Name
Owned For
Owner Type
Purchase Details
Closed on
Aug 9, 2001
Sold by
Clayton Gary Lee and Sara Charlene Clayton
Bought by
Cabe Tina
Current Estimated Value
Purchase Details
Closed on
Oct 22, 1992
Sold by
Clayton Gary Lee
Bought by
Clayton Gary Lee and Sara Charlene Cl
Purchase Details
Closed on
Dec 19, 1988
Sold by
Clayton Lois M Est
Bought by
Clayton Gary Lee
Purchase Details
Closed on
Mar 16, 1979
Sold by
Tate Sara H
Bought by
Clayton Lois M Est
Purchase Details
Closed on
Nov 19, 1977
Sold by
Hurley G M
Bought by
Tate Sara H
Purchase Details
Closed on
Apr 21, 1975
Sold by
Tate Sara H
Bought by
Hurley G M
Purchase Details
Closed on
Aug 30, 1974
Sold by
Tate Paul J
Bought by
Tate Sara H
Purchase Details
Closed on
Aug 22, 1970
Sold by
Tucker Larry D
Bought by
Tate Paul J
Purchase Details
Closed on
Jun 16, 1967
Sold by
Tucker Richard A and Tucker Dorothy
Bought by
Tucker Larry D
Purchase Details
Closed on
Jan 1, 1901
Bought by
Tucker Richard A and Tucker Dorothy
Create a Home Valuation Report for This Property
The Home Valuation Report is an in-depth analysis detailing your home's value as well as a comparison with similar homes in the area
Home Values in the Area
Average Home Value in this Area
Purchase History
| Date | Buyer | Sale Price | Title Company |
|---|---|---|---|
| Cabe Tina | $74,000 | -- | |
| Clayton Gary Lee | -- | -- | |
| Clayton Gary Lee | -- | -- | |
| Clayton Lois M Est | $22,000 | -- | |
| Tate Sara H | -- | -- | |
| Hurley G M | $13,000 | -- | |
| Tate Sara H | -- | -- | |
| Tate Paul J | $500 | -- | |
| Tucker Larry D | $9,400 | -- | |
| Tucker Richard A | -- | -- |
Source: Public Records
Tax History Compared to Growth
Tax History
| Year | Tax Paid | Tax Assessment Tax Assessment Total Assessment is a certain percentage of the fair market value that is determined by local assessors to be the total taxable value of land and additions on the property. | Land | Improvement |
|---|---|---|---|---|
| 2024 | $34 | $56,133 | $9,843 | $46,290 |
| 2023 | $34 | $50,336 | $8,839 | $41,497 |
| 2022 | $35 | $37,693 | $7,232 | $30,461 |
| 2021 | $850 | $34,214 | $7,232 | $26,982 |
| 2020 | $792 | $30,794 | $5,524 | $25,270 |
| 2019 | $735 | $28,234 | $5,524 | $22,710 |
| 2018 | $705 | $26,560 | $5,524 | $21,036 |
| 2017 | $688 | $25,588 | $5,524 | $20,064 |
| 2016 | $697 | $25,572 | $5,920 | $19,652 |
| 2015 | $772 | $24,852 | $2,600 | $22,252 |
| 2014 | $772 | $30,197 | $2,600 | $27,597 |
Source: Public Records
Map
Nearby Homes
- 0 Cypress St NE Unit 7494593
- 0 Cypress St NE Unit 10422946
- 1 Fir St NE
- 7 Ash St NE
- 40 Dogwood St NE
- 42 Dogwood St NE
- 27 Oak St NE
- 205 Couper St NE
- 20 Lindberg Dr NE
- 2 Lindberg Dr NE
- 0 Euclid Ave Unit 10617853
- 219 North Ave NE
- 15 Roseway Cir NE
- 313 Woodward St NE
- 104 Earl Ln NE
- 408 Reece St NE
- 5 Roseway Cir NE
- 411 Woodward St NE
- 3 Roseway Cir NE
- 325 Ross St NE
- 17 Poplar St NE
- 19 Poplar St NE
- 16 Poplar St NE
- 11 Poplar St NE
- 11 Poplar St NE
- 11 Poplar St NE
- 21 Poplar St NE
- 21 Poplar St NE Unit 325
- 20 Poplar St NE
- 22 Poplar St NE
- 9 Poplar St NE
- 14 Poplar St NE
- 23 Poplar St NE
- 24 Poplar St NE
- 2 Quince St NE
- 8 Redwood St NE
- 26 Poplar St NE
- 12 Poplar St NE
- 7 Poplar St NE
- 6 Redwood St NE