15 Pretto Way Plymouth, MA 02360
Estimated Value: $398,000 - $478,000
2
Beds
1
Bath
650
Sq Ft
$678/Sq Ft
Est. Value
About This Home
This home is located at 15 Pretto Way, Plymouth, MA 02360 and is currently estimated at $440,583, approximately $677 per square foot. 15 Pretto Way is a home located in Plymouth County with nearby schools including South Elementary School, Plymouth South Middle School, and Plymouth South High School.
Ownership History
Date
Name
Owned For
Owner Type
Purchase Details
Closed on
Sep 15, 2004
Sold by
Muir Robert J and Muir Margaret K
Bought by
Hiltz Falmouth Rt
Current Estimated Value
Purchase Details
Closed on
Dec 20, 2001
Sold by
Newman Ruth
Bought by
Muir Robert J and Muir Margaret K
Home Financials for this Owner
Home Financials are based on the most recent Mortgage that was taken out on this home.
Original Mortgage
$134,995
Interest Rate
6.54%
Mortgage Type
Purchase Money Mortgage
Create a Home Valuation Report for This Property
The Home Valuation Report is an in-depth analysis detailing your home's value as well as a comparison with similar homes in the area
Home Values in the Area
Average Home Value in this Area
Purchase History
| Date | Buyer | Sale Price | Title Company |
|---|---|---|---|
| Hiltz Falmouth Rt | $250,000 | -- | |
| Muir Robert J | $142,100 | -- |
Source: Public Records
Mortgage History
| Date | Status | Borrower | Loan Amount |
|---|---|---|---|
| Previous Owner | Muir Robert J | $134,995 |
Source: Public Records
Tax History Compared to Growth
Tax History
| Year | Tax Paid | Tax Assessment Tax Assessment Total Assessment is a certain percentage of the fair market value that is determined by local assessors to be the total taxable value of land and additions on the property. | Land | Improvement |
|---|---|---|---|---|
| 2025 | $4,458 | $351,300 | $212,500 | $138,800 |
| 2024 | $4,269 | $331,700 | $208,100 | $123,600 |
| 2023 | $4,024 | $293,500 | $181,700 | $111,800 |
| 2022 | $3,564 | $231,000 | $165,200 | $65,800 |
| 2021 | $3,592 | $222,300 | $165,200 | $57,100 |
| 2020 | $3,551 | $217,200 | $160,800 | $56,400 |
| 2019 | $3,286 | $198,700 | $143,100 | $55,600 |
| 2018 | $3,090 | $187,700 | $132,100 | $55,600 |
| 2017 | $3,047 | $183,800 | $132,100 | $51,700 |
| 2016 | $2,811 | $172,800 | $121,100 | $51,700 |
| 2015 | $2,685 | $172,800 | $121,100 | $51,700 |
| 2014 | $2,676 | $176,900 | $121,100 | $55,800 |
Source: Public Records
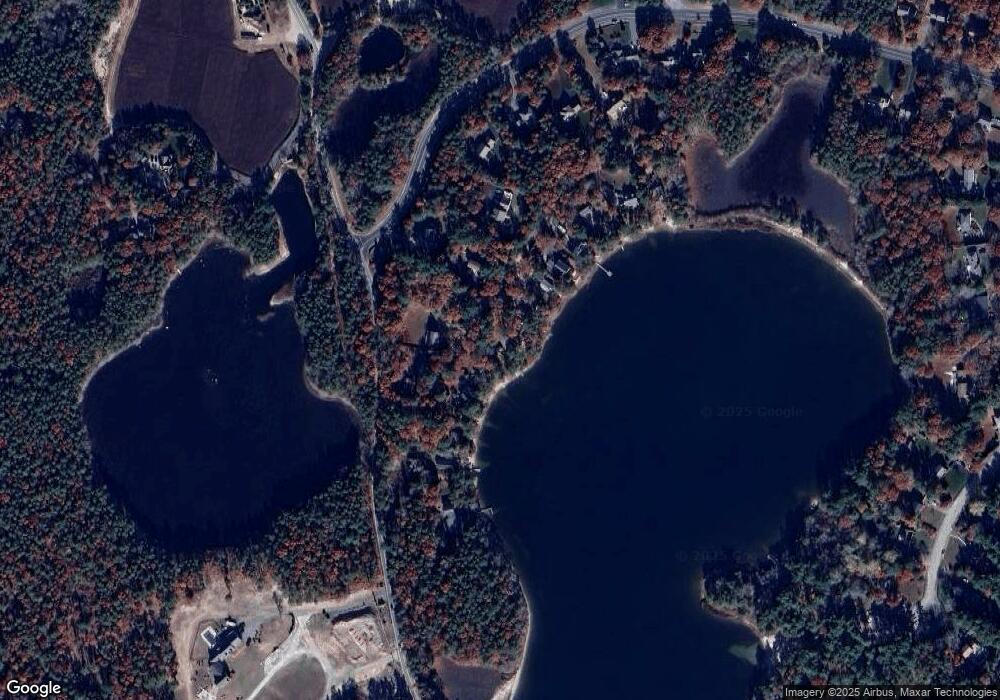
Map
Nearby Homes