Studio
--
Bath
12,300
Sq Ft
2.25
Acres
About This Home
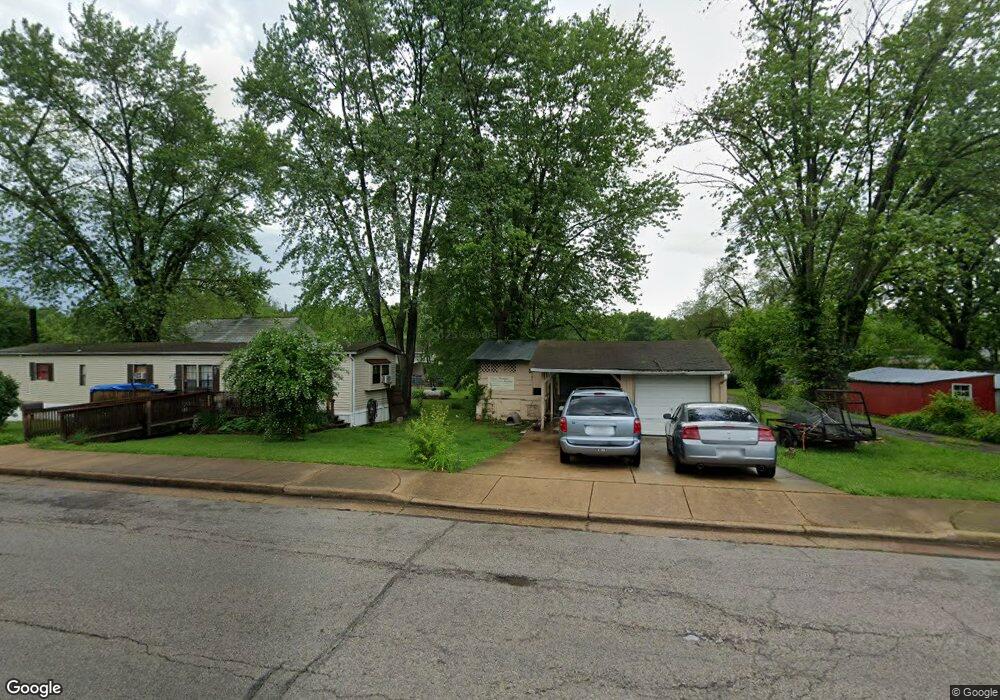
This home is located at 15 Progress Dr, Union, MO 63084. 15 Progress Dr is a home located in Franklin County with nearby schools including Union High School and Immaculate Conception School.
Ownership History
Date
Name
Owned For
Owner Type
Purchase Details
Closed on
Jan 22, 2024
Sold by
J Tye Properties Llc
Bought by
Real Estate Options Llc
Purchase Details
Closed on
Oct 29, 2019
Sold by
Real Estate Options Llc
Bought by
J Tye Properties Llc
Purchase Details
Closed on
Jan 15, 2015
Sold by
Citizens Bank
Bought by
Real Estate Options Llc
Purchase Details
Closed on
Sep 12, 2011
Sold by
R & K Carson Development Llc
Bought by
Citizens Bank
Purchase Details
Closed on
Apr 3, 2006
Sold by
R & K Carson Development Llc
Bought by
Pacific South Llc
Purchase Details
Closed on
Mar 2, 2006
Sold by
Carson Ronald D and Carson Karen L
Bought by
R & K Carson Development Llc
Purchase Details
Closed on
Aug 3, 2005
Sold by
Union Development Corp
Bought by
Carson Ronald D and Carson Karen L
Home Financials for this Owner
Home Financials are based on the most recent Mortgage that was taken out on this home.
Original Mortgage
$60,000
Interest Rate
1.25%
Mortgage Type
Construction
Create a Home Valuation Report for This Property
The Home Valuation Report is an in-depth analysis detailing your home's value as well as a comparison with similar homes in the area
Home Values in the Area
Average Home Value in this Area
Purchase History
| Date | Buyer | Sale Price | Title Company |
|---|---|---|---|
| Real Estate Options Llc | -- | None Listed On Document | |
| J Tye Properties Llc | -- | None Available | |
| Real Estate Options Llc | $285,000 | -- | |
| Citizens Bank | $448,834 | None Available | |
| Pacific South Llc | -- | None Available | |
| R & K Carson Development Llc | -- | None Available | |
| Carson Ronald D | -- | None Available |
Source: Public Records
Mortgage History
| Date | Status | Borrower | Loan Amount |
|---|---|---|---|
| Previous Owner | Carson Ronald D | $60,000 |
Source: Public Records
Tax History Compared to Growth
Tax History
| Year | Tax Paid | Tax Assessment Tax Assessment Total Assessment is a certain percentage of the fair market value that is determined by local assessors to be the total taxable value of land and additions on the property. | Land | Improvement |
|---|---|---|---|---|
| 2025 | $8,242 | $127,930 | $0 | $0 |
| 2024 | $8,242 | $135,088 | $0 | $0 |
| 2023 | $8,790 | $135,088 | $0 | $0 |
| 2022 | $8,098 | $124,211 | $0 | $0 |
| 2021 | $8,110 | $124,211 | $0 | $0 |
| 2020 | $8,146 | $122,899 | $0 | $0 |
| 2019 | $8,127 | $122,899 | $0 | $0 |
| 2018 | $6,962 | $110,080 | $0 | $0 |
| 2017 | $6,978 | $110,080 | $0 | $0 |
| 2016 | $7,135 | $110,208 | $0 | $0 |
| 2015 | $7,029 | $110,208 | $0 | $0 |
| 2014 | $7,906 | $123,866 | $0 | $0 |
Source: Public Records
Map
Nearby Homes
- 873 Saint Andrews Dr
- 1066 Vardon Meadows Dr
- 1064 Vardon Meadows Dr
- 2 Summerfield at St Andrews Commons
- 1056 Vardon Meadows Dr
- 2 Aspen at St Andrews Manors
- 3 Sterling at St Andrews Manors
- 2 Maple at St Andrews Manors
- 1007 Watson Ridge Dr
- 1001 Braid Trail Dr
- 1012 Braid Trail Dr
- 2 Aspen II at St Andrews Mano
- 2 Ashford at St Andrews Manor
- 644 Arrowhead Ln
- 2 St James at St Andrews
- 1025 Oakmont Ln
- 2 Berwick at St Andrews Manor
- 124 Vista Vallarta Dr
- 134 Vista Vallarta Dr
- 140 Vista Vallarta Dr
- 17 Progress Dr
- 5 Progress Pkwy
- 1658 Prairie Dell Rd
- 1841 Prairie Dell Rd
- 28acres Prairie Dell Rd
- 1604 Prairie Dell Rd
- 7722 Lakefield Ct
- 1811 Prairie Dell Rd
- 7718 Lakefield Ct
- 7714 Lakefield Ct
- 1600 Prairie Dell Rd
- 7710 Lakefield Ct
- 7706 Lakefield Ct
- 1694 Prairie Dell Rd
- 411 Augusta Place
- 417 Augusta Place
- 405 Augusta Place
- 423 Augusta Place
- 393 Augusta Place
- 1706 Prairie Dell Rd