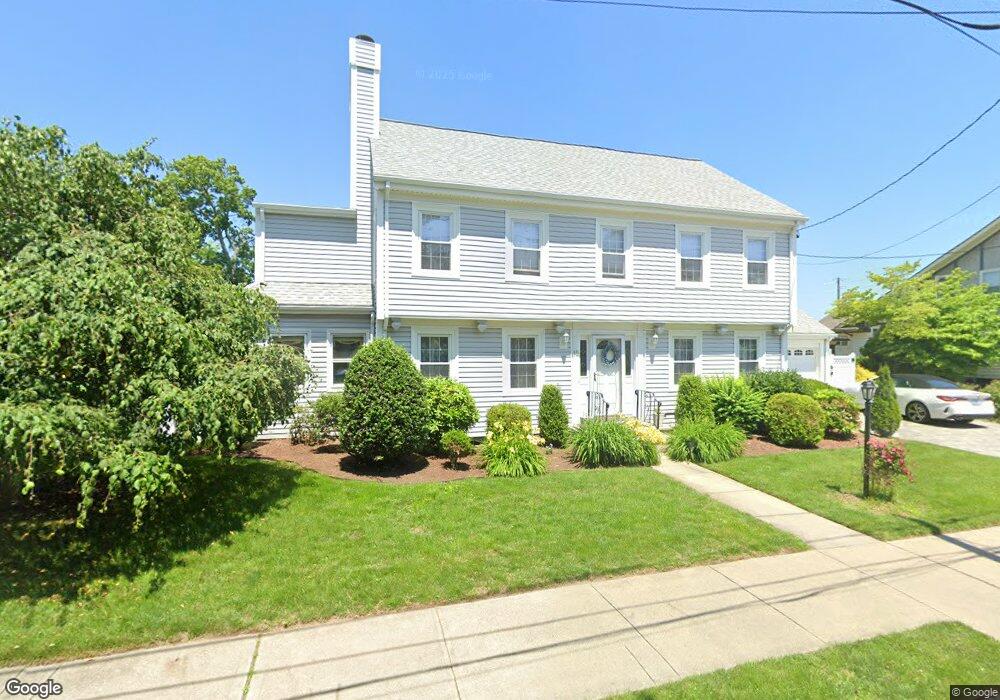
15 Progress St Pawtucket, RI 02860
Oak Hill NeighborhoodEstimated Value: $884,000 - $936,000
3
Beds
2
Baths
2,741
Sq Ft
$334/Sq Ft
Est. Value
About This Home
This home is located at 15 Progress St, Pawtucket, RI 02860 and is currently estimated at $915,911, approximately $334 per square foot. 15 Progress St is a home located in Providence County with nearby schools including International Charter School, Blackstone Academy Charter School, and Jewish Community Day School Of Rhode Island.
Ownership History
Date
Name
Owned For
Owner Type
Purchase Details
Closed on
Jun 12, 2014
Sold by
Mcburney Crisine L and James Christine L
Bought by
James Laurene E and James Sarah A
Current Estimated Value
Purchase Details
Closed on
Dec 14, 1989
Sold by
Silverman David R
Bought by
James Richard H
Create a Home Valuation Report for This Property
The Home Valuation Report is an in-depth analysis detailing your home's value as well as a comparison with similar homes in the area
Home Values in the Area
Average Home Value in this Area
Purchase History
| Date | Buyer | Sale Price | Title Company |
|---|---|---|---|
| James Laurene E | -- | -- | |
| James Richard H | $330,000 | -- |
Source: Public Records
Mortgage History
| Date | Status | Borrower | Loan Amount |
|---|---|---|---|
| Previous Owner | James Richard H | $100,000 | |
| Previous Owner | James Richard H | $25,000 | |
| Previous Owner | James Richard H | $90,000 | |
| Previous Owner | James Richard H | $100,000 |
Source: Public Records
Tax History
| Year | Tax Paid | Tax Assessment Tax Assessment Total Assessment is a certain percentage of the fair market value that is determined by local assessors to be the total taxable value of land and additions on the property. | Land | Improvement |
|---|---|---|---|---|
| 2025 | $9,189 | $698,800 | $362,600 | $336,200 |
| 2024 | $8,623 | $698,800 | $362,600 | $336,200 |
| 2023 | $8,827 | $521,100 | $202,900 | $318,200 |
| 2022 | $8,640 | $521,100 | $202,900 | $318,200 |
| 2021 | $8,640 | $521,100 | $202,900 | $318,200 |
| 2020 | $9,394 | $449,700 | $219,100 | $230,600 |
| 2019 | $9,394 | $449,700 | $219,100 | $230,600 |
| 2018 | $9,052 | $449,700 | $219,100 | $230,600 |
| 2017 | $9,308 | $409,700 | $187,900 | $221,800 |
| 2016 | $8,968 | $409,700 | $187,900 | $221,800 |
| 2015 | $8,968 | $409,700 | $187,900 | $221,800 |
| 2014 | $8,242 | $357,400 | $156,600 | $200,800 |
Source: Public Records
Map
Nearby Homes
- 5 Lowden St
- 51 Wilcox Ave
- 122 Lowden St
- 6 Alfred Stone Rd
- 136 Hillside Ave
- 18 Dunnell Ave
- 32 Carver St
- 80 Hillside Ave
- 126 Dunnell Ave
- 11 Sherman St
- 349 Pleasant St
- 345 Pleasant St
- 159 Dunnell Ave
- 750 Elmgrove Ave
- 540 Blackstone Blvd
- 41 Campbell Terrace
- 167 George St
- 62 Harwich Rd
- 39 Harwich Rd
- 187 Sisson St
Your Personal Tour Guide
Ask me questions while you tour the home.