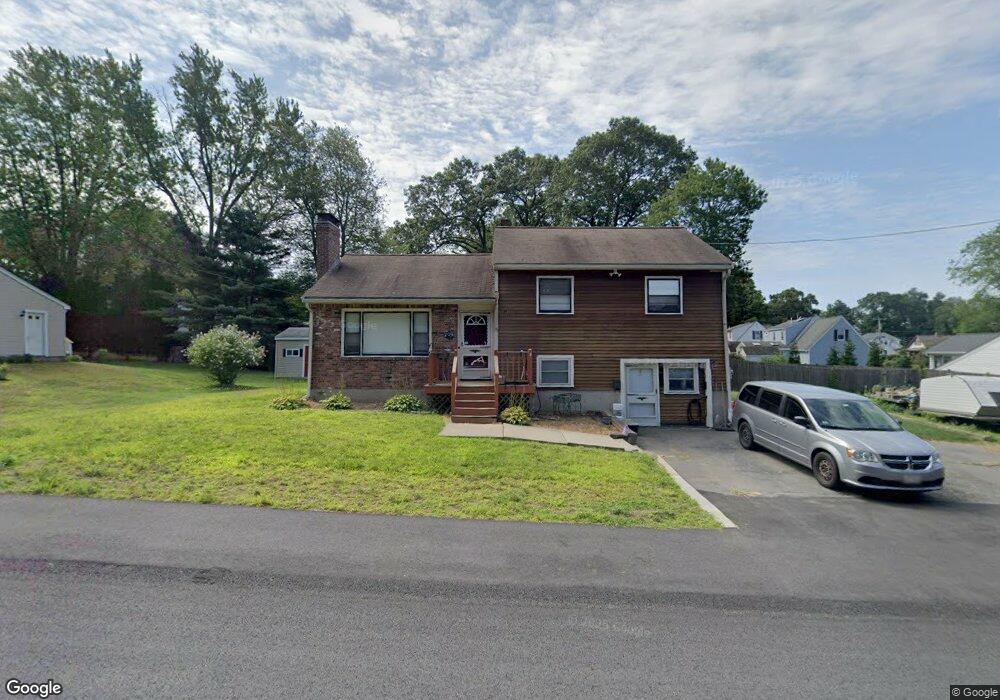
15 Progress St Weymouth, MA 02188
South Weymouth NeighborhoodEstimated Value: $572,000 - $629,000
3
Beds
2
Baths
1,050
Sq Ft
$565/Sq Ft
Est. Value
About This Home
This home is located at 15 Progress St, Weymouth, MA 02188 and is currently estimated at $593,203, approximately $564 per square foot. 15 Progress St is a home located in Norfolk County with nearby schools including Frederick C Murphy, Abigail Adams Middle School, and Weymouth Middle School Chapman.
Ownership History
Date
Name
Owned For
Owner Type
Purchase Details
Closed on
Sep 12, 2001
Sold by
Dinon Victor J and Dinon Arline C
Bought by
Dinon William R and Dinon Lori A
Current Estimated Value
Home Financials for this Owner
Home Financials are based on the most recent Mortgage that was taken out on this home.
Original Mortgage
$75,000
Interest Rate
6.99%
Mortgage Type
Purchase Money Mortgage
Create a Home Valuation Report for This Property
The Home Valuation Report is an in-depth analysis detailing your home's value as well as a comparison with similar homes in the area
Home Values in the Area
Average Home Value in this Area
Purchase History
| Date | Buyer | Sale Price | Title Company |
|---|---|---|---|
| Dinon William R | $125,000 | -- |
Source: Public Records
Mortgage History
| Date | Status | Borrower | Loan Amount |
|---|---|---|---|
| Closed | Dinon William R | $110,000 | |
| Closed | Dinon William R | $75,000 |
Source: Public Records
Tax History Compared to Growth
Tax History
| Year | Tax Paid | Tax Assessment Tax Assessment Total Assessment is a certain percentage of the fair market value that is determined by local assessors to be the total taxable value of land and additions on the property. | Land | Improvement |
|---|---|---|---|---|
| 2025 | $5,374 | $532,100 | $260,000 | $272,100 |
| 2024 | $5,645 | $549,700 | $247,700 | $302,000 |
| 2023 | $5,320 | $509,100 | $229,300 | $279,800 |
| 2022 | $5,095 | $444,600 | $194,700 | $249,900 |
| 2021 | $4,824 | $410,900 | $194,700 | $216,200 |
| 2020 | $4,620 | $387,600 | $194,700 | $192,900 |
| 2019 | $4,509 | $372,000 | $187,200 | $184,800 |
| 2018 | $4,403 | $352,200 | $178,200 | $174,000 |
| 2017 | $4,313 | $336,700 | $169,800 | $166,900 |
| 2016 | $4,146 | $323,900 | $163,300 | $160,600 |
| 2015 | $3,898 | $302,200 | $155,800 | $146,400 |
| 2014 | $3,764 | $283,000 | $145,000 | $138,000 |
Source: Public Records
Map
Nearby Homes
- 116 Belmont St
- 501 Commerce Dr Unit 2310
- 501 Commerce Dr Unit 1111
- 501 Commerce Dr Unit 4206
- 501 Commerce Dr Unit 4308
- 501 Commerce Dr Unit 4306
- 200 Justin Dr Unit 3
- 655 Summer St
- 48 Apple Tree Ln
- 255 West St
- 262 West St
- 54 Federal St
- 24 Blake Rd
- 67 Abby Rd
- 432 Grove St
- 441 Grove St
- 92 Mercury St
- 33 Congress St
- 972 Liberty St
- 2 Tara Dr Unit 1